Biodiversity and Ecosystems in Latin America and the Caribbean
Explore the economic importance of biodiversity and ecosystems in Latin America and the Caribbean through an economic valuation of ecosystem services. Understand the benefits of sustainable ecosystem management compared to business as usual practices, and discover the sectoral analysis focusing on various areas like forestry, fisheries, agriculture, and more.

Download Presentation

Please find below an Image/Link to download the presentation.
The content on the website is provided AS IS for your information and personal use only. It may not be sold, licensed, or shared on other websites without obtaining consent from the author. If you encounter any issues during the download, it is possible that the publisher has removed the file from their server.
You are allowed to download the files provided on this website for personal or commercial use, subject to the condition that they are used lawfully. All files are the property of their respective owners.
The content on the website is provided AS IS for your information and personal use only. It may not be sold, licensed, or shared on other websites without obtaining consent from the author.
E N D
Presentation Transcript
Latin America and the Caribbean: A Biodiversity Super Power IMPORTANCE OF BIODIVERSITY AND ECOSYSTEMS IN ECONOMIC GROWTH AND EQUITY IN LATIN AMERICA AND THE CARIBBEAN: AN ECONOMIC VALUATION OF ECOSYSTEMS UNDP
Basic facts on the Reports methodology Analyzes sectoral outputs at a micro-economic level, comparing costs and benefits between different types of natural resource management practices While acknowledging that there exist a wide range of such practices, to simplify the analysis the Report focuses on two contrasting, archetypical categories, or scenarios, into which virtually all the practices can be fit Business as Usual (BAU): The more conventional set of management practices optimizes short-run gain without consideration to ecosystems or to externalized costs Sustainable Ecosystem Management (SEM): This scenario focuses on long-term output, inclusive of all impacts and costs
A sectoral analysis based Report Timber and non-timber forest time products (NTFP) Cross-cutting areas Water and hydrological services Tourism Fisheries Protected Areas Agriculture
Sectoral ES benefits provided by Protected Areas as a cross-cutting area Fisheries Essential habitat for breeding, nurseries and juveniles; no- take areas to rebuild stocks and diversity; protection of vulnerable habitats like coral reefs and mangrove stands Forestry Timber and NTFP concessions, carbon storage, revenue flows that sustain conservation Ecosystem services contribute to the economies of LAC countries through benefits to different sectors Urban settlements Drinking water, disaster mitigation, hydropower Nature-based tourism Water for consumption, attractive natural features, wild species to watch, local job and income creation, fiscal and foreign exchange revenues Agriculture Low sediment irrigation water, genetic resources, pollination, economically- important wild species
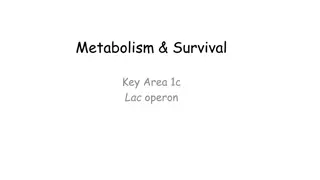
Relations amongst ecosystem services (ES) and other inputs, production practices and sectoral outputs Technology Labor Production practices Sectoral outputs Capital Ecosystem services negative Source: A. Bovarnick positive
Approach to Ecosystem Services (ES) and Biodiversity Ecosystem services are used as proxies for biodiversity that feed into economic processes since they are easier to connect with sectoral outputs The term ES is used as shorthand for the value of ecosystems and biodiversity throughout the Report Tangible contributions of ES to production and value creation are through these processes Focuses on ecosystems that interface with economic processes
On the methodological approach to ES ES are viewed as one of several inputs required for production, along with labor, technology and capital ES both affect and are affected by production practices Their relative value will vary, depending on ES abundance, the costs and impacts of other inputs and the policy framework Methodology does not attempt to isolate the input function of each ES and the resulting economic value (as in 1ha of forest supports X pollinators which increase by Y% the yield of nearby crops, resulting in a gain of $Z ) Inference is used to approximate the economic value of ES inputs into production
ES under SEM and BAU There are certain production practices which maintain and use ES (grouped under SEM) An example in agriculture might be the difference in farm yields with the application of organic compost in a SEM agroforestry context versus yields using chemical fertilizer in similar situations (e.g., hillside farming) under BAU There are other production practices which degrade ES and rely more heavily on other inputs (categorized as BAU) On comparing the available evidence for many countries on the costs and benefits of these different production practices the Report has noted that, in those cases where a full accounting is made, the net benefits are, on average, consistently greater for the SEM practice
On BAU and SEM methodology Enables entrepreneurs and policy makers to perceive overall patterns and to make decision about specific management practices with a better understanding of the overall costs and benefits related to ES value and maintenance Displays the frequently hidden costs as indirect or externalized costs- of ES value and maintenance Provides data beyond a focus on production output crop yield for agriculture, stock harvest for fisheries and visitor flow for tourism and allows a fuller trade-off analysis of the hidden (external and future) costs of depleting ES Organizing economic data around BAU (without ES) and SEM (with (ES) allows decision makers to compare the costs and benefits of different management practices and focus on the practices that make most sense
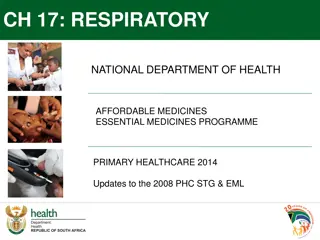
The BAU and SEM concepts enable the approximate capture of ES value over time to infer that ES of some sort are operating at a level that permit additional production (over BAU) or lower costs Figure 2.2 shows the hypothesis that under BAU, net revenues decline over time, while those of SEM may start lower but remain constant or rise. This leads to a point at which SEM replaces BAU as the optimal management approach.
Biodiversity and ecosystems role in sectoral growth in LAC: Agriculture (I) About 73% or water withdrawn in LAC is devoted to agricultural production; 8.5 million ha of crops in the region require irrigation, making management of water resources critical to the viability of the agricultural sector Many ES are free inputs into agriculture production If damaged or lost they need to be replaced by human-made interventions that can act as substitutes (e.g. loss of soil fertility may be compensated by increased use of fertilizers) Pollination is another key service provided by nature, with around 35% of crops worldwide supported by natural pollinators However, some ES such as supporting services (e.g. nutrient cycling, pest regulation and pollination) cannot be substituted for by human-made capital
Biodiversity and ecosystems role in sectoral growth in LAC: Agriculture (II) SEM can harness ES and provide higher returns to farmers than more traditional farming systems The ecological benefits associated with agroforestry include carbon sequestration, biodiversity protection, soil improvements, crop pollination and water provision World Bank study on agroforestry systems across Central America (Current et al. 1995): Profitability is dependent on the site resources and markets Of the 21 systems analyzed, 40% had significantly higher returns than traditional systems. One agroforestry system had a net present value (NPV) of $2,863/ha (over 10 years, 1992 values) compared to $1,423/ha for contour planting and $764/ha for woodlots Only 10% performed less well than traditional systems However in this and other SEM agricultural systems incentives and technical assistance are usually needed to promote uptake, since returns can lag in the early years until trees mature
Resource degradation lowers the delivery rate for ES, and is approximated in the distance by which the ES line falls under BAU Figure 2. 3 indicates what changes are behind the drop in net revenues under BAU. For SEM, the ES line maintains its level or rises in response to improvement in the natural resource base under SEM, as shown here. In specific cases, the ES being delivered might be measure in m3/hour of sediment free water, number/night turtles available for watching on the beach, or tons/year of fish biomass grown (in the fishery stock itself or in the prey eaten). Depletion of these ES-related resources would lead to lower BAU revenues in the previous graph, Figure 2.2.
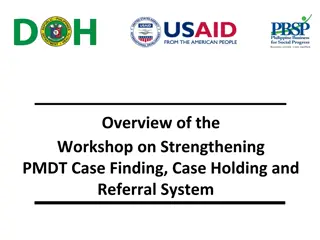
The BAU paradigm: Externalized costs In its simplest form the paradigm shows net revenues from BAU that are either constant or start decreasing only at a late date. Yields for the BAU model are above those of SEM for most of the planning horizon. Standard discounting of private net revenues, even if a very low discount rate is used, will favor BAU, because SEM generates more revenues than BAU only in a very distant future. The case for SEM against BAU is based on the observation that BAU may be associated with negative externalities that, if accounted for, would switch the relative advantage of each alternative. That is, though BAU might initially make financial sense from a private perspective (the green BAU curve running above the SEM curve) it might not make sense after externalities are accounted for (i.e. the red BAU curve running below SEM after accounting for negative externalities).
Market forces Figure 2.9 depicts a situation in which consumer preferences for certified products raise the revenues of goods produced under SEM, but only up to a point, after which the market premium is reduced and certification becomes a market access requisite. High premiums can still be observed for certified organic vegetables and fruits, but in the case of certified timber, the market is already more likely at the latter stage of the graph. Revenue increases also stem from gains in efficiency from better farming practices. BAU net revenues have fallen because demand and prices for non-certified produced have dropped.
Introducing policy instruments into the construed scenarios (I) Governments can create incentives and other conditions to change the balance in favor of BAU or SEM. For example, Figure 2.10 shows a situation in which a policy is introduced that lowers the profitability of BAU. This could be the elimination of perverse subsidies that favor BAU practices (like subsidies for purchase of fuel or fishing ships in over-exploited fisheries, or subsidized agrochemical products for industrial cropping schemes). Other examples include introduction of pricing of natural resources as inputs into productive activities or the use of green taxes to correct for negative externalities (e.g., a tax on emissions, elimination of fuel subsidies for fishing boats in the Galapagos).
Introducing policy instruments into the construed scenarios (II) An alternative strategy would be to encourage SEM with the use of policies that raise the profits of cleaner or more sustainable management strategies, or that facilitate transition to them. A well-known example is the use of payments for ES, and of subsidized access to credit that leads to green investments. Figure 2.11 captures this situation.
Typical practices included under BAU and SEM for the Agriculture Sector BAU SEM Agroforestry systems: multiple cropping/greater diversity in crops; selection of crops that are more resilient to climate change (where that is a concern); maintenance of native varieties and cultivars Monoculture Use of organic fertilizers; integrated pest management (IPM) Intensive use of agrochemicals (pesticides, fertilizers) Integrated soil and water conservation to (i) mitigate soil erosion and (ii) maximize rainwater harvest and conservation Intensive irrigation systems with high water loss Land clearance resulting in loss of primary habitat and soil fertility Low need for inputs by better fertility management
Examples of SEM/BAU analysis for the agriculture sector Another example is with pesticide application in agriculture Ministries can compare farms that undertake BAU practices (i.e. heavy application of pesticide without due treatment with resulting pesticide contamination of adjacent water bodies) affecting downstream agricultural production with farms that undertake SEM practices (reduced pesticide use and cost, with more reliance on integrated pest control and natural predators), as well as reduced water contamination The downstream costs of water contamination can help policy makers make a more informed decision about the economic value of pesticide application, as well as the flip side the economic value of maintaining the ES of natural pest control, which can reduce costly reliance on pesticide use (ever higher and more complex as the pests develop resistance) Analysis show that coffee farms produce higher yields partly because the forest supports pollinators for the coffee Then the Ministry of Agriculture can weigh the economic benefits to coffee farmers of conserving adjacent forest versus those benefits of converting the forest to new farms
Costs of soil erosion (I) Aggregate supply or price of agricultural output Recent evidence suggests that more than 40% of the world s agricultural land is moderately to extremely degraded, resulting in a 13% reduction in crop productivity. This can affect: Consumption by poor farm households National wealth Agricultural income and economic growth Source: Wood et al. 2000; Winters et al. 2004
Costs of soil erosion (II) 38% of Ecuador is considered at high risk of degradation Losses in soil fertility have resulted in the purchase of costly imported agrochemicals Ecuador The associated costs of BAU are partly externalized, as downstream sedimentation and loss in fertility BAU agriculture is estimated to generate 299 million m3 of soil loss per year This has resulted in sedimentation of waterways and high levels of eutrophication The costs to recover just two lakes for tourism -Izabal and Atitlan- exceeds $653 million Guatemala Yearly erosion from farm and pasture land removes nutrients worth 17% of the crop value and 14% of the value of livestock products Costa Rica
Benefits and costs of pesticides (Case studies) Ecuador: Economic burden of illness from pesticide Brazil: Annual expenses to treat pesticide poisoning In fifty reported cases in the Montufar region (1991-1992), the estimated average treatment cost was approximately $17/case, which is 11 times the daily agricultural wage in the region Brazilian Ministry of Health estimated 263,400 cases of poisoning from pesticide exposure as of 1998 On the cost side, approximately $47 million is spent yearly too treat pesticide poisoning in Brazil. Such costs, presumably mostly externalized by the firms that use the pesticides The agricultural workers affected by the poisoning tend to be very poor, with the costs of treatment representing a heavy financial burden Sources: Cole et al. 2000; Lins 1996 in Dasgupta 2001
Conditions under a SEM scenario 10-20 years Costs of impacts are internalized Long term gains Long-term flow of ecosystem goods and services Degradation of ES is avoided As a practical, cost-effective way to realize long-run profits Support ecosystem sustainability
Valuation examples of key ecosystem services provided to agriculture Ecosystem services Quantitative estimates Monetary estimates Threats SOIL FERTILITY Soil conservation in S. Brazil raised corn productivity 40%, soybeans 21%, beans 3%, and tobacco 32% Soil conservation in S. Brazil raised corn productivity 40%, soybeans 21%, beans 3%, and tobacco 32% Poor land management practices both on- and off- farm that result in soil degradation or erosion WATER / CLIMATE REGULATION SERVICES 73% of water used is devoted to agriculture 73% of water used is devoted to agriculture Increasing demand/over- abstraction Intensification of irrigation Water pollution caused by point and diffused sources including agricultural ones POLLINATION 35% of plant based crops worldwide supported by animal pollinators 35% of plant based crops worldwide supported by animal pollinators Changing land use Agrochemicals Climate change Invasive species GENETIC RESOURCES Generally maintains agriculture productivity, protect against diseases Generally maintains agriculture productivity, protect against diseases Land conversion Monoculture PEST CONTROL Bats in Mexico are estimated to reduce need for pesticides by 25-50% Bats in Mexico are estimated to reduce need for pesticides by 25-50% Habitat loss
Economic benefits from maintaining specific ecosystem services (Agriculture sector examples) Soil fertility Water supply On-farm benefits of soil fertility can be measured based on the lost productivity avoided through the adoption of soil conservation practices Study of land use management in Lajeado, Sao Jos in Southern Brazil found that better soil management increased crop productivity Between 1990 and 1996, maize, soybeans, beans and tobacco production rose by 40%, 21%, 3%, and 32% respectively In monetary terms, total farm income increased $98,460/yr for maize, $56,071/yr for soybeans, and $10,730/yr for tobacco Investments in the form of subsidies to farmers and road improvements to encourage the uptake of erosion control practices were expected to be recovered in four years| The provision of water to agriculture is a key ecosystem service. However, deriving an economic estimate of this service is complex In LAC irrigation water is provided free or at low cost, meaning that the market price does not provide a suitable proxy for the social cost of water In addition, the cost of water extraction and irrigation vary depending on available technology and the water source Bassi (2002) found that reduced soil erosion, improved basic sanitation and better management of animal waste led to a fall in the concentration of fecal coliform bacteria at two sampling points: one in the middle of the watershed and the other at the treatment station. Water treatment costs were reduced by 50% (from $3,000 to $1,500/month for 7,500 m3) due to lower need for chemicals Cranford, Trivedi and Queiroz (2010), based on a preliminary analysis, provide a lower bound estimate of the gross benefits of precipitation, related to the climate regulating services of the Amazonian basin, to crops in Brazil and Paraguay at $8 billion a year Source: Bassi 2002
Estimated net benefits of soil conservation in Central America Country and Area Conservation measure Crop Net present value ($)* Internal rate of return (%) Years to soil breakdown COSTA RICA BARVA TIERRA BLANCA TURRUBARES TURRUBARES Diversion ditches Diversion ditches Diversion ditches Terraces Coffee Potatoes Coco yam Coco yam -920 -3340 1110 4140 <0 <0 84,2 60,2 >100 >100 2 3 DOMINICAN REPUBLIC EL NARANJAL Diversion ditches Pigeon peas, peanuts, beans -132 16,9 >100 GUATEMALA PATZIT Terraces Corn -156 16,5 >100 HAITI MAISSADE Residue barriers Rock walls Corn, sorghum Corn, sorghum 1180 956 Positive** Positive** 0 1 HONDURAS TATUMBLA YORITO Diversion ditches Diversion ditches Corn Corn 909 83 56,5 21,9 4 18 PANAMA COCL Terraces Rice, corn, yucca, beans 34 27,2 8 SOURCE: CASE STUDIES IN LUTZ, PAGIOLA AND REICHE (1994B) *Net present value is computed over fifty years using a 20% discount rate ** Undefined, because net returns are positive from year one onward
Economic benefits from specific farm practices to maintain ecosystem services: Organic agriculture Organic agriculture basic facts and figures Benefits or organic farming vary depending on the crop and the circumstances. Samaniego S nchez (2006), for example, did not identify significant differences in soil nutrients and leaf tissue between conventional and organic production of red peppers in Costa Rica. The benefits of organic coffee production have been more widely examined. Organic agriculture is now commercially practiced in 210 countries and represents 31 million ha of certified cropland and pasture (approx 0.7% of global agricultural land), 62 million ha of certified wild lands and a market of $40 billion in 2006 (2% of food retailed in developed countries) Organic production occupies 4% of arable land in Uruguay, 1.7% in Argentina, 1.5% in Chile, 1.0% in Bolivia and 0.24% in Brazil, Colombia and Panama Latin America is an exporter of organic products; domestic markets are still developing Guerreiro Barbosa and Gomes, 2007
Economic benefits from specific farm practices to maintain ecosystem services: Organic agriculture (IV) Soil acidity decreased in the organic coffee regime, while phosphorus, potassium and calcium rose In Costa Rica and Nicaragua, comparison of various coffee conventional systems with organic production showed that under appropriate technology organic can attain the same productivity as conventional systems (Soto 2003) A major environmental benefit of organic coffee was reduced herbicide use Economic benefits of organic agriculture have been documented in several studies In a feasibility study of organic farmers in Brazil, income generated on organic farms ranged from $366 to $2,505/ha (Guerreiro Barboso and Gomes Lages 2007) Small scale coffee producers in Nicaragua were shown to achieve a 28% increase in net returns by their participation in certified organic coffee cooperatives, despite coffee quality not always improving (Bacon 2005) Organic producers may also enjoy financial advantages Calo and Ise (2005) concluded that in Mexico, fair trade but not organic certification allowed organic coffee producers to increase profits. Similar results were obtained in Brazil, Nicaragua, the Dominican Republic and Guatemala (Potts 2007; Arnould and Plastina 2006) Generally, fair trade certification not only gave higher prices to farmers but also lowered market risk due to price variability and improved market access through participation in the cooperative (Bacon 2005)
Conclusions: Sectoral outputs are dependent on a variety of ES inputs, for example (I) Timber and non timber forest time products (NTFP) production in both natural forests and plantations depend on soil fertility, soil moisture, microclimate, photosynthesis and growth by using and releasing O2, biodiversity and gene pools, pollination and seed distribution, soil stabilization, and forest water cycles Productivity in agriculture depends, in fundamental ways, on the management and maintenance of certain ES: water availability, soil fertility, microclimate, pollination, and both pest and disease control. Agriculture uses 73% of all water abstracted in LAC. Furthermore, ES will build resilience of the sector to climate change, by protecting genetic resources, soil fertility, and water quality In tourism, the most valuable ES for the sector are water quantity and quality, beach material, attractive viewscapes, and biodiversity for recreational activities like bird and whale watching, or jungle treks Fisheries are dependent on the provisioning and regulating ES. The most direct input of marine ES to fisheries is by providing fish habitats essential to the life stages of fish species, including the underlying food chains that supply energy. Of particular importance to fisheries are habitats crucial for spawning and/or recruitment, such as mangrove stands, seagrass beds, and coral reefs. Regulating and supporting ES (such as sediment retention, temperature control, water filtration, and nutrient-cycling) are essential to fisheries but difficult to value directly
Conclusions: ES can provide access to emerging markets(II) In the past, maintaining ES was viewed as a barrier to economic growth, evidence suggests that conditions are changing: ES are important for sustained growth by providing access to emerging green markets, avoiding damage costs, building resilience to climate change, and increasing the efficient use of scarce resources and, thereby, reducing production costs. Countries can increase the economic benefits of ES and SEM practice through specific policy changes and by supporting particular production and supply chains in the transition to SEM
Conclusions: ES can provide access to emerging markets(III) Firms respond to both policy and market incentives. Consumers, increasingly, want the natural resources that are used as inputs to be sustainably managed. There are signs of companies taking early mover advantage and positioning themselves in the marketplace based on sustainable practices. Access to affordable finance can also be an incentive. Several investment funds have been created to support sustainable ES use in LAC, including Root Capital, Verde Ventures, Futuro Forestales, EcoEnterprise Fund, and CAMBio. These funds have invested in numerous SEM enterprises in agriculture, forestry, and tourism.
Recommendations Sectoral plans should undertake trade-off analysis between maximization of short-term production and ES maintenance Level the playing field and incentivize SEM Develop economic instruments and planning to reduce off-site degradation of ES Increase the asset value of biodiversity and ES Augment public sector revenues from use of ES Generate and capture data on ES
Where to download the main Report and related thematic and national reports http://www.undp.org/latinamerica/biodiversity- superpower/Index.htm


 and other")
 and")


")
")