Biomarker Expression in HepG2 Cells: Compound-Induced Analysis
Explore compound-induced biomarker expression in HepG2 cells with mean values and standard deviations from multiple experiments. Gene upregulation thresholds and fold change inductions are highlighted for various compounds including APAP, ASP, BPR, CBZ, CHL, DFN, FAM, and HYZ.

Download Presentation

Please find below an Image/Link to download the presentation.
The content on the website is provided AS IS for your information and personal use only. It may not be sold, licensed, or shared on other websites without obtaining consent from the author. If you encounter any issues during the download, it is possible that the publisher has removed the file from their server.
You are allowed to download the files provided on this website for personal or commercial use, subject to the condition that they are used lawfully. All files are the property of their respective owners.
The content on the website is provided AS IS for your information and personal use only. It may not be sold, licensed, or shared on other websites without obtaining consent from the author.
E N D
Presentation Transcript
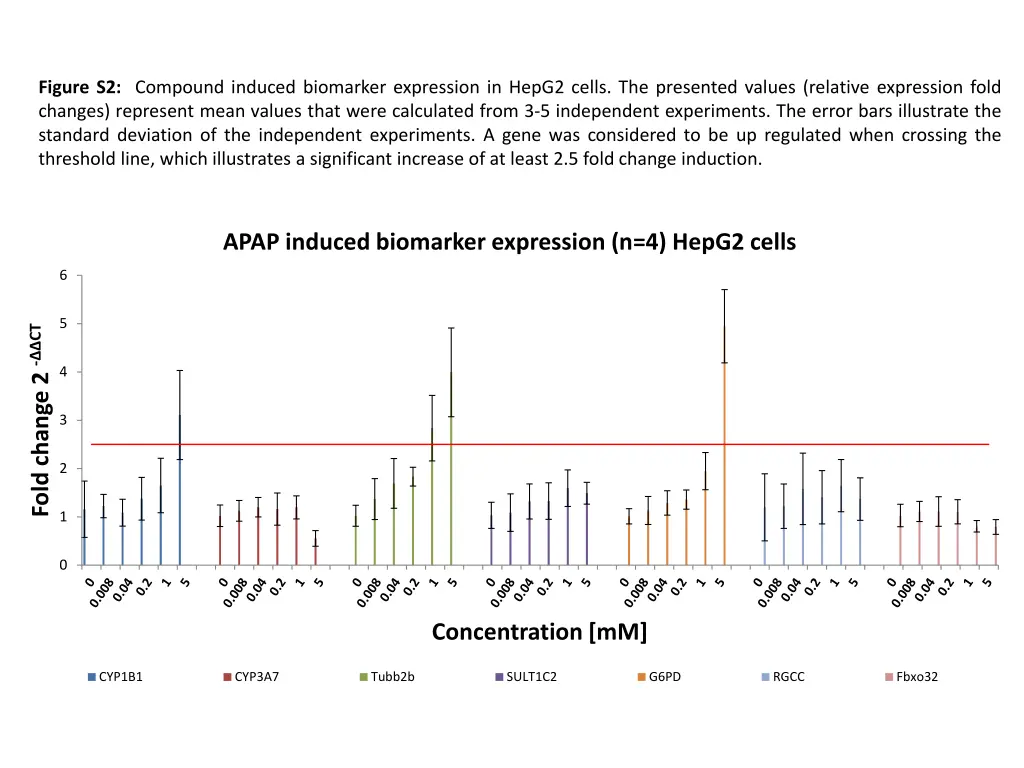
Figure S2: Compound induced biomarker expression in HepG2 cells. The presented values (relative expression fold changes) represent mean values that were calculated from 3-5 independent experiments. The error bars illustrate the standard deviation of the independent experiments. A gene was considered to be up regulated when crossing the threshold line, which illustrates a significant increase of at least 2.5 fold change induction. APAP induced biomarker expression (n=4) HepG2 cells 6 5 Fold change 2 - CT 4 3 2 1 0 Concentration [mM] CYP1B1 CYP3A7 Tubb2b SULT1C2 G6PD RGCC Fbxo32
ASP induced biomarker expression (n=3) HepG2 cells 3 2.5 Fold change 2 - CT 2 1.5 1 0.5 0 Concentration [mM] CYP1B1 CYP3A7 Tubb2b SULT1C2 G6PD RGCC Fbxo32
BPR induced biomarker expression (n=3) HepG2 cells 4.5 4 Fold change 2 - CT 3.5 3 2.5 2 1.5 1 0.5 0 Concentration [nM] CYP1B1 CYP3A7 Tubb2b SULT1C2 G6PD RGCC Fbxo32
CBZ induced biomarker expression (n=3) HepG2 cells 25 Fold change 2 - CT 20 15 10 5 0 Concentration [ M] CYP1B1 CYP3A7 Tubb2b SULT1C2 G6PD RGCC Fbxo32
CHL induced biomarker expression (n=3) HepG2 cells 6 5 Fold change 2 - CT 4 3 2 1 0 Concentration [ M] CYP1B1 CYP3A7 Tubb2b SULT1C2 G6PD RGCC Fbxo32
DFN induced biomarker expression (n=3) HepG2 cells 7 6 Fold change 2 - CT 5 4 3 2 1 0 Concentration [ M] CYP1B1 CYP3A7 Tubb2b SULT1C2 G6PD RGCC Fbxo32
FAM induced biomarker expression (n=3) HepG2 cells 3 2.5 Fold change 2 - CT 2 1.5 1 0.5 0 Concentration [ M] CYP1B1 CYP3A7 Tubb2b SULT1C2 G6PD RGCC Fbxo32
HYZ induced biomarker expression (n=4) HepG2 cells 7 6 Fold change 2 - CT 5 4 3 2 1 0 Concentration [ M] CYP1B1 CYP3A7 Tubb2b SULT1C2 G6PD RGCC Fbxo32
INAH induced biomarker expression (n=4) HepG2 cells 7 6 Fold change 2 - CT 5 4 3 2 1 0 Concentration [mM] CYP1B1 CYP3A7 Tubb2b SULT1C2 G6PD RGCC Fbxo32
LAB induced biomarker expression (n=3) HepG2 cells 3 2.5 Fold change 2 - CT 2 1.5 1 0.5 0 Concentration [ M] CYP1B1 CYP3A7 Tubb2b SULT1C2 G6PD RGCC Fbxo32
LEV induced biomarker expression (n=3) HepG2 cells 3 2.5 Fold change 2 - CT 2 1.5 1 0.5 0 Concentration [ M] CYP1B1 CYP3A7 Tubb2b SULT1C2 G6PD RGCC Fbxo32
MEL induced biomarker expression (n=3) HepG2 cells 3.5 3 Fold change 2 - CT 2.5 2 1.5 1 0.5 0 Concentration [nM] CYP1B1 CYP3A7 Tubb2b SULT1C2 G6PD RGCC Fbxo32
NFT induced biomarker expression (n=3) HepG2 cells 70 60 Fold change 2 - CT 50 40 30 20 10 0 Concentration [ M] CYP1B1 CYP3A7 Tubb2b SULT1C2 G6PD RGCC Fbxo32
NIM induced gene expression (n=3) HepG2 cells 20 18 Fold change 2 - CT 16 14 12 10 8 6 4 2 0 Concentration [ M] CYP1B1 CYP3A7 Tubb2b SULT1C2 G6PD RGCC Fbxo32
PhB induced biomarker expression (n=3) HepG2 cells 12 10 Fold change 2 - CT 8 6 4 2 0 Concentration [ M] CYP1B1 CYP3A7 Tubb2b SULT1C2 G6PD RGCC Fbxo32
PMZ induced biomarker expression (n=3) HepG2 cells 8 7 Fold change 2 - CT 6 5 4 3 2 1 0 Concentration [ M] CYP1B1 CYP3A7 Tubb2b SULT1C2 G6PD RGCC Fbxo32
PPL induced biomarker expression (n=3) HepG2 cells 9 8 Fold change 2 - CT 7 6 5 4 3 2 1 0 Concentration [ M] CYP1B1 CYP3A7 Tubb2b SULT1C2 G6PD RGCC Fbxo32
RIF induced biomarker expression (n=3) HepG2 cells 4.5 4 Fold change 2 - CT 3.5 3 2.5 2 1.5 1 0.5 0 Concentration [ M] CYP1B1 CYP3A7 Tubb2b SULT1C2 G6PD RGCC Fbxo32
VPA induced biomarker expression (n=3) HepG2 cells 25 Fold change 2 - CT 20 15 10 5 0 Concentration [mM] CYP1B1 CYP3A7 Tubb2b SULT1C2 G6PD RGCC Fbxo32

 HepG2 cells")
 HepG2 cells")
 HepG2 cells")
 HepG2 cells")
 HepG2 cells")
 HepG2 cells")
 HepG2 cells")
 HepG2 cells")
 HepG2 cells")
 HepG2 cells")
 HepG2 cells")
 HepG2 cells")
 HepG2 cells")
 HepG2 cells")
 HepG2 cells")
 HepG2 cells")
 HepG2 cells")
 HepG2 cells")
 HepG2 cells")
 HepG2 cells")