Biometric Indices Growth Charts and Data Analysis at Sunnybrook: A Comprehensive Overview
Download Presenatation

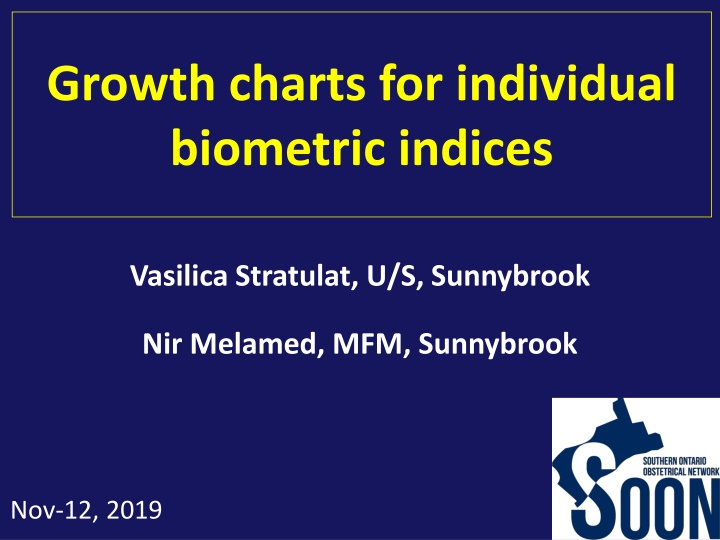
Explore growth charts for individual biometric indices by Vasilica Stratulat and Nir Melamed from Sunnybrook, covering topics such as dating methods, growth percentiles, and calculations for assessing fetal development. Dive into detailed charts, equations, and characteristics of selected charts utilized at the center.

Download Presentation
Please find below an Image/Link to download the presentation.
The content on the website is provided AS IS for your information and personal use only. It may not be sold, licensed, or shared on other websites without obtaining consent from the author. If you encounter any issues during the download, it is possible that the publisher has removed the file from their server.
You are allowed to download the files provided on this website for personal or commercial use, subject to the condition that they are used lawfully. All files are the property of their respective owners.
The content on the website is provided AS IS for your information and personal use only. It may not be sold, licensed, or shared on other websites without obtaining consent from the author.
E N D
Presentation Transcript
Growth charts for individual biometric indices Vasilica Stratulat, U/S, Sunnybrook Nir Melamed, MFM, Sunnybrook Nov-12, 2019
Questions of interest 8 equations weeks) Index centiles Dating (Index GA = 8.8+0.55xHC- 0.0028*HC3 Mean HC = -10.34+1.48xGA- 0.000226*GA3 Compare charts using SB/MSH data (Nir) Contents (1) 1st trimester dating (CRL, BPD) (2) 2nd & 3rd trimester dating (HC, BPD, AC, FL) (3) Growth percentiles (indices (4) Best way to calculate AUA (5) How to expresses indices in the report? Present charts (Vasi) percentiles)
(1) 1st trimester dating CRL & BPD
Characteristics of selected charts Reference Design N Population Methodology Comments CRL Robinson 75 Prosp. 334 Cross sectional 6-14 weeks TA Reasonably intelligent LMP Prosp 416 White LMP IVF Canada Multiethnic LMP Spontaneous Pregnancy LMP Cross Sectional 5-18 weeks TA/TV 6-14 weeks TA/TV 6-16 weeks TA 6-14 weeks TA/TV Hadlock 92 Retro. 94 Cross Sectional Daya 93 Prosp 4265 Longitudinal IG-21 Prosp 3760 Cross Sectional Verburg 08 BPD Hadlock 82 Hadlock 84 Prosp Prosp 533 361 White White Cross sectional Cross Sectional 12-40 weeks 14-42 weeks
What is being used in SOON? Center Sunnybrook Ants Toi, CEOU Hani Akouri, St Jose Howard Berger, SMH True North Imaging Pat Mohide, St Joseph s MUMC Byron DeFrance Elad Mei-Dan, NYGH Rose Rahmani, RRI Port Perry Fetal unit, MSH Credit Valley CRL Daya 93 Daya 93 Daya 93 Hadlock 92 Hadlock 92 Daya 93 Daya 93 Hadlock 92 Robinson 75 Daya 93 Robinson 75 ?
CRL Weeks 16 14 Gestational Age (Weeks) 12 10 Hadlock 92' Daya 93' Robinson 75' IG21 Verburg 08' 8 6 4 0 1 2 3 4 5 6 7 8 CRL (cm)
BPD weeks 40 35 30 GA (weeks) 25 Hadlock82 Hadlock84 20 15 10 5 0 2 4 6 8 10 12 BPD (cm)
Deviation from actual GA (Sunnybrook data ,NT scan, N=1,136) 92
Proportion within 2-5 days (Sunnybrook data ,NT scan, N=1,136) 100% 90% 80% 70% CRL Hadlock 92' CRL Daya 93' 60% CRL Robinson 75' 50% CRL IG21 40% Best options: CRL Verburg 08' 30% CRL - Daya most accurate, Canadian BPD - Hadlock 82 BPD Hadlock 82' BPD Hadlock 84' 20% 10% 0% 2 days 3 days 4 days 5 days
Summary of Best Charts Dating (Index weeks) Hadlock 82 CRL Contents (1) 1st trimester dating (CRL, BPD) (2) 2nd & 3rd trimester dating (HC, BPD, AC, FL) (3) Growth percentiles (indices (4) How to calculate AUA (5) How to expresses indices in the report? Daya 93 percentiles)
(2) 2nd and 3rd trimester dating (Index weeks)
Evolution of sonographic dating 1982- Hadlock HC, BPD-April, AC- May, FL- August 1984-Hadlock Fetal age by multiple parameters 1984-January Jeanty-Gestational Age from long bones 1990-January-Hadlock- Fetal age and growth 1997 June-Chitty- New charts for ultrasound dating of pregnancy 2008-March-Verburg New charts for U/S dating of pregnancy 2014-IG21st-One size Fits All 2017-WHO International charts, but need local adjustments
Characteristics of selected charts Reference Design N Population Methodology 338-533 Caucasian Prospective Hadlock 82 Longitudinal Cross Sectional Cross sectional Longitudinal 316 Caucasian Prospective Hadlock 84 1040 Caucasian Retrospective Nicolaides 94 250 Caucasian Prospective Jeanty 84 Cross Sectional Longitudinal 27,679 Mixed Retrospective Cervenak 17 4321 Multiethnic Prospective IG-21 Longitudinal 1387 Multiethnic Prospective WHO Cross Sectional 663 Caucasian/Af ro-Caribbean Prospective Chitty 94
What is being used in SOON? Center Which charts are you using to express biometric indices as weeks? BPD HC AC FL Sunnybrook Hadlock 82/84 Hadlock 82/84 Hadlock 82/84 Hadlock 84 Ants Toi, CEOU Hadlock 82 Hadlock 82 Hadlock 82 Jeanty 84 Hani Akouri, St Jose Hadlock 82 Hadlock 82 Hadlock 82 Hadlock 82 Howard Berger SMH Hadlock 84 Hadlock 84 Hadlock 84 Hadlock 84 True North Imaging Hadlock 82 Hadlock 82 Hadlock 82 Hadlock 82 Pat Mohide, SJH Hadlock 82 Hadlock 82 Hadlock 82 Hadlock 82 Byron DeFrance, MUMC Hadlock 82 Hadlock 82 Hadlock 82 Hadlock 82 Elad Mei-Dan, NYGH Hadlock 84 Hadlock 84 Hadlock 84 Hadlock 84 Rose Rahmani RRI Hadlock 82 Hadlock 82 Hadlock 84 Jeanty 84 Port Perry Hadlock 82 Hadlock 82 Hadlock 82 Jeanty Chitty 94 Verburg 08? Verburg 08? Verburg 08? Fetal unit, MSH Credit Valley Hadlock 82 Hadlock 82 Hadlock 82 Hadlock 82
Proportion within 1 week (SB + MSH data ,17-40w, N=1,984) HC BPD AC FL 100% 90% 80% 70% 60% 50% 40% Within 1 week 30% 20% 10% 0%
Deviation from expected GA (SB + MSH data ,17-40w, N=1,984) FL
Summary of Best Charts Index weeks Index centiles Hadlock 82 Hadlock 84 Hadlock 82 Hadlock 84 CRL Contents (1) 1st trimester dating (CRL, BPD) (2) 2nd & 3rd trimester dating (HC, BPD, AC, FL) (3) Growth percentiles (indices (4) How to calculate AUA (5) How to expresses indices in the report? Daya 93 percentiles)
(3) Growth percentiles (Index percentiles)
What is being used in SOON? Center Which charts are you using to express biometric indices as percentiles? BPD HC AC FL Sunnybrook Hadlock 82/84 Hadlock 82/84 Hadlock 82/84 Hadlock 84 Ants Toi, CEOU Hadlock 82 Hadlock82 Hadlock 82 Jeanty 84 Hani Akouri, St Jose Hadlock 82 Hadlock 82 Hadlock 82 Jeanty 84 Howard Berger, SMH Hadlock 84 Hadlock 84 Hadlock 84 Hadlock 84 True North Imaging Hadlock 82 Hadlock 82 Hadlock 82 Hadlock 82 Pat Mohide, St Joseph s Hadlock 82 Hadlock 82 Hadlock 82 Hadlock 82 MUMC Byron DeFrance Hadlock 82 Hadlock 82 Hadlock 82 Jeanty 84 Elad Mei-Dan, NYGH Hadlock 84 Hadlock 84 Hadlock 84 Hadlock 84 Rose Rahmani RRI Hadlock 84 Hadlock 84 Hadlock 84 Jeanty 84 Port Perry Hadlock 82 Hadlock 82 Hadlock 82 Hadlock 82 Chitty 94 Verburg 08 Verburg 08 Verburg 08 Fetal unit, MSH Credit Valley Hadlock 82 Hadlock 82 Hadlock 82 Hadlock 82
HC - Mean 35 Chitty IG-21 30 25 HC (cm) Hadlock 82' Hadlock 84' Jeanty 1984' Chervenak 2017 IG21 WHO Chitty 20 15 10 5 12 13 14 15 16 17 18 19 20 21 22 23 24 25 26 27 28 29 30 31 32 33 34 35 36 37 38 39 40 GA (weeks)
HC 5th percentile 35 Chitty 30 IG-21 25 HC (cm) Hadlock 82' Hadlock 84' Jeanty 1984' Chervenak 2017 IG21 WHO Chitty 20 Jeanty 15 10 5 12 13 14 15 16 17 18 19 20 21 22 23 24 25 26 27 28 29 30 31 32 33 34 35 36 37 38 39 40 GA (weeks)
HC 95th percentile 40 Chitty 35 IG-21 30 HC (cm) Hadlock 82' Hadlock 84' Jeanty 1984' Chervenak 2017 IG21 WHO Chitty 25 20 Jeanty 15 10 5 12 13 14 15 16 17 18 19 20 21 22 23 24 25 26 27 28 29 30 31 32 33 34 35 36 37 38 39 40 GA (weeks)
Distribution of HC percentile (SB + MSH data ,17-40w, N=1,984) Hadlock 82 Hadlock 84 Jeanty Chitty IG-21
Proportion of abnormal HC (SB + MSH data ,17-40w, N=1,984) 25% Best options (17-40w): Hadlock 84 20% Less 5p Over 95p Proportion of cases 15% 10% 5% 0% Hadlock 82' Hadlock 84' Jeanty 1984' IG21 WHO Chitty
Proportion of abnormal HC by GA (SB + MSH data , N=1,984) 25% Best options (17-22w): Hadlock 84 17-22w Proportion of cases 20% Less 5p Over 95p 15% 10% 5% 0% Hadlock 82' Hadlock 84' Jeanty 1984' IG21 WHO Chitty 25% Best options (27-40w) : Hadlock 84 27-40w Less 5p Proportion of cases 20% Over 95p 15% 10% 5% 0% Hadlock 82' Hadlock 84' Jeanty 1984' IG21 WHO Chitty
Summary of Best Charts Index weeks Index centiles Hadlock 82 Hadlock 84 Hadlock 84 Hadlock 82 Hadlock 84 CRL Daya 93
BPD - Mean 10 9 8 7 6 BPD (cm) Hadlock 82' 5 Hadlock 84' 4 Jeanty 1984' 3 WHO 2 Chitty 1 0 12 13 14 15 16 17 18 19 20 21 22 23 24 25 26 27 28 29 30 31 32 33 34 35 36 37 38 39 40 GA (weeks)
BPD 5th percentile 10 9 8 7 6 BPD (cm) Hadlock 82' 5 Hadlock 84' 4 Jeanty 1984' 3 WHO 2 Chitty Hadlock 84 1 0 12 13 14 15 16 17 18 19 20 21 22 23 24 25 26 27 28 29 30 31 32 33 34 35 36 37 38 39 40 GA (weeks)
BPD 95th percentile 12 10 8 BPD (cm) Hadlock 82' 6 Hadlock 84' Jeanty 1984' 4 WHO Chitty 2 0 12 13 14 15 16 17 18 19 20 21 22 23 24 25 26 27 28 29 30 31 32 33 34 35 36 37 38 39 40 GA (weeks)
Proportion of abnormal BPD (SB + MSH data ,17-40w, N=1,984) 14% Best options 17-40w: Hadlock 82 ? Jeanty? Less 5p Over 95p 12% 10% Proportion of cases 8% 6% 4% 2% 0% Hadlock 82' Hadlock 84' Jeanty 1984' WHO Chitty
Proportion of abnormal BPD by GA (SB + MSH data , N=1,984) Best options (17-22w): None ideal Hadlock 82? Jeanty? 14% 17-22w Less 5p 12% Proportion of cases Over 95p 10% 8% 6% 4% 2% 0% Hadlock 82' Hadlock 84' Jeanty 1984' WHO Chitty Best options (27-40w): None ideal Hadlock 82? WHO? 18% Less 5p Over 95p 27-40w 16% Proportion of cases 14% 12% 10% 8% 6% 4% 2% 0% Hadlock 82' Hadlock 84' Jeanty 1984' WHO Chitty
Summary of Best Charts Index weeks Index centiles Hadlock 82 Hadlock 82 Hadlock 84 Hadlock 84 Hadlock 82 Hadlock 84 CRL Daya 93
AC- Mean 40 35 30 25 AC (cm) Hadlock 82' 20 Hadlock 84' IG21 15 WHO 10 Chitty 5 Hadlock 84 0 12 13 14 15 16 17 18 19 20 21 22 23 24 25 26 27 28 29 30 31 32 33 34 35 36 37 38 39 40 GA (weeks)
AC 5th percentile 40 35 30 IG-21 25 AC (cm) Hadlock 82' Hadlock 84' IG21 WHO Chitty 20 15 10 5 Hadlock 84 0 12 13 14 15 16 17 18 19 20 21 22 23 24 25 26 27 28 29 30 31 32 33 34 35 36 37 38 39 40 GA (weeks)
AC 95th percentile 45 WHO 40 35 30 AC (cm) Hadlock 82' Hadlock 84' IG21 WHO Chitty 25 20 15 10 5 0 12 13 14 15 16 17 18 19 20 21 22 23 24 25 26 27 28 29 30 31 32 33 34 35 36 37 38 39 40 GA (weeks)
Distribution of AC percentile (SB + MSH data ,17-40w, N=1,984) Hadlock 84 Hadlock 82 IG-21 Chitty
Proportion of abnormal AC (SB + MSH data ,17-40w, N=1,984) Best options (17-40w): Hadlock82 25% Less 5p Over 95p 20% Proportion of cases 15% 10% 5% 0% Hadlock 82' Hadlock 84' IG21 WHO Chitty
Proportion of abnormal AC by GA (SB + MSH data , N=1,984) 30% Best options (17-22w): Hadlock82? 84? 25% Proportion of cases Less 5p 20% Over 95p 17-22w 15% 10% 5% 0% Hadlock 82' Hadlock 84' IG21 WHO Chitty 25% Best options (27-40w): Hadlock82? Chitty? Less 5p Proportion of cases 20% Over 95p 27-40w 15% 10% 5% 0% Hadlock 82' Hadlock 84' IG21 WHO Chitty
Summary of Best Charts Index weeks Index centiles Hadlock 82 Hadlock 82 Hadlock 84 Hadlock 84 Hadlock 82 Hadlock 82 Hadlock 84 CRL Daya 93
FL- Mean 9 8 7 IG-21 6 FL (cm) Hadlock 82' Hadlock 84' Jeanty 1984' IG21 WHO Chitty 5 4 3 2 1 0 12 13 14 15 16 17 18 19 20 21 22 23 24 25 26 27 28 29 30 31 32 33 34 35 36 37 38 39 40 GA (weeks)
FL 5th percentile 8 7 IG-21 6 5 FL (cm) Hadlock 82' Hadlock 84' Jeanty 1984' IG21 WHO Chitty 4 3 2 1 0 12 13 14 15 16 17 18 19 20 21 22 23 24 25 26 27 28 29 30 31 32 33 34 35 36 37 38 39 40 GA (weeks)
FL 95th percentile 9 8 IG-21 7 6 FL (cm) Hadlock 82' Hadlock 84' Jeanty 1984' IG21 WHO Chitty 5 4 3 2 1 0 12 13 14 15 16 17 18 19 20 21 22 23 24 25 26 27 28 29 30 31 32 33 34 35 36 37 38 39 40 GA (weeks)
Distribution of AC percentile (SB + MSH data ,17-40w, N=1,984) Hadlock 82 Hadlock 84 IG-21 Jeanty Chitty
Proportion of abnormal FL (SB + MSH data ,17-40w, N=1,984) 30% Best options (17-40w): Hadlock 82/84 Less 5p Over 95p 25% 20% Proportion of cases 15% 10% 5% 0% Hadlock 82' Hadlock 84' Jeanty 1984' IG21 WHO Chitty


 1st trimester dating")


 2nd and 3rd")


 Growth percentiles")


")


")
")


")
")


")