BIOPAMA IMET TRAINING
The session covers analyzing IMET assessment results to understand the effectiveness of Protected Area (PA) management. Participants will learn to interpret graphs, identify key aspects, and discuss scenarios to improve management outcomes. Explore the IMET Management Effectiveness Dash Board and examine results to gauge progress towards management objectives. Learn how to use defined values for monitoring daily PA activities and decision-making. Gain insights on visualizing scores, identifying red flags, and cross-analyzing elements of the PA management cycle.

Download Presentation

Please find below an Image/Link to download the presentation.
The content on the website is provided AS IS for your information and personal use only. It may not be sold, licensed, or shared on other websites without obtaining consent from the author.If you encounter any issues during the download, it is possible that the publisher has removed the file from their server.
You are allowed to download the files provided on this website for personal or commercial use, subject to the condition that they are used lawfully. All files are the property of their respective owners.
The content on the website is provided AS IS for your information and personal use only. It may not be sold, licensed, or shared on other websites without obtaining consent from the author.
E N D
Presentation Transcript
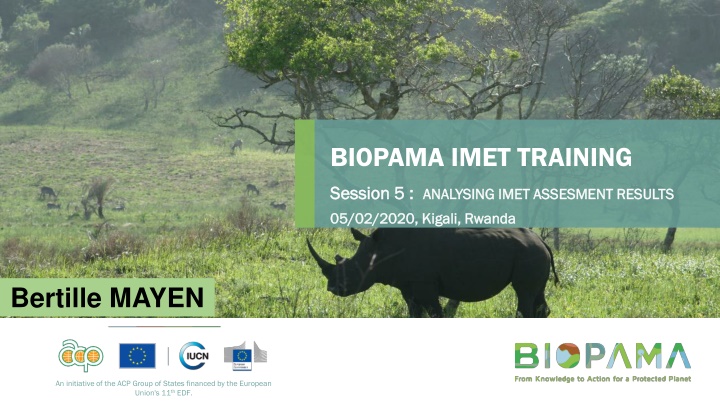
BIOPAMA IMET TRAINING Session 5 : Session 5 : ANALYSING IMET ASSESMENT RESULTS ANALYSING IMET ASSESMENT RESULTS 05/02/2020, Kigali, Rwanda 05/02/2020, Kigali, Rwanda Bertille MAYEN An initiative of the ACP Group of States financed by the European Union's 11thEDF.
LEARNING OBJECTIVES OF THE SESSION ANALYSING IMET ASSESMENT RESULTS At the end of the session, participants will be able to : Examine the meaning of graphs and histograms in IMET Identify key aspects for analyzing IMET results Discuss possible scenario of IMET results
IMET Management Effectiveness Dash Board At the end of the assessment , the last column of the IMET form provides you a dash board visual effect, where information collected during the exercise are shown Management effectiveness measures to what extent the outputs of a process led to direct outcomes (effects/impacts) & outcomes contributed to achieving the objective (management objective).
Result is what is achieved by acting toward a defined goal & it contributes to generating an effect Results are presented @2 levels: Global results showing the scores of the 6 PA management cycle; Specifics scores on each area of assessment >50% >33.9% >34.50%
Values defined can be used for the management & monitoring of the PA daily activities, and more specifically for the steps to be taken toward planning, resources mobilization (inputs), process, outputs and outcomes. it s important to identify red flags to inform decision makers to cater for arising issues / flows in the management of the PA
The Management Effectiveness Dash Board allows you to do a: Rapid assessment/quick overview of 6 elements of the PA management cycle Visualization, interpretation of the scores generated; highlight of red flags and a deep dive into understanding the reasons / issues behind the scores; Cross analysis: differences and similarities between the red flag elements of the PA management cycle
Following Trends and take appropriate measures to improve the PA management is key 2017 2016 2015 Peer Review results to ensure data credibility & stakeholders buy in Reporting : bridge the gap between data & action; Policy advocacy : inform decision makers
DIFFERENT LEVELS OF RESULTS ANALYSIS & PURPOSE RESULT ANALYSIS Global analysis based on the data collected & scores Focus / target user s analysis for specific needs Cross analysis for comparison / complimentary purposes Analysis can also depend on the assessment approach (IMET integrated or IMET modular approach) Results@ National level / landscape for line ministries, donors, PA mangers & key partners Scaling up for national strategies and policy ; monitoring the PA system Results@landscape level / Regional for partners, regional bodies with the aim of harmonising policies, strategic planning, action plan Results @ site level analysis & peer review for the PA manager and stakeholders to define steps to move forward and management objectives to improve management of the PA
IMET = DISSECTING - STRUCTURING - ANALYSING Structuring information to support decision- making in order to better identify problems and formulate the conservation actions and strategies Information flow : information & analyzes + knowledge of the status of the ressources & priorities. Dissecting information provided to identify issues for problems solving. most appropriate IMET Analysis One should pay careful attention to degree of reliability of the information provided (High, Medium or Low).
The Biodiversity and Protected Areas Management Programme (BIOPAMA) is an initiative of the ACP Group of States financed by the European Union's 11th EDF.