Bioreactor Impeller Speed Impact on hMSC Growth and Metabolism
Explore the effects of varying bioreactor impeller speeds on human mesenchymal stem cell (hMSC) growth and metabolism over six days in a controlled microcarrier culture system. The study examines cell concentration, lactate dehydrogenase production, total protein concentration, metabolite flux, specific outgrowth rate, cell diameter, CFU efficiency, and more. Results show the importance of impeller speed in maintaining cell health and productivity.

Download Presentation

Please find below an Image/Link to download the presentation.
The content on the website is provided AS IS for your information and personal use only. It may not be sold, licensed, or shared on other websites without obtaining consent from the author. If you encounter any issues during the download, it is possible that the publisher has removed the file from their server.
You are allowed to download the files provided on this website for personal or commercial use, subject to the condition that they are used lawfully. All files are the property of their respective owners.
The content on the website is provided AS IS for your information and personal use only. It may not be sold, licensed, or shared on other websites without obtaining consent from the author.
E N D
Presentation Transcript
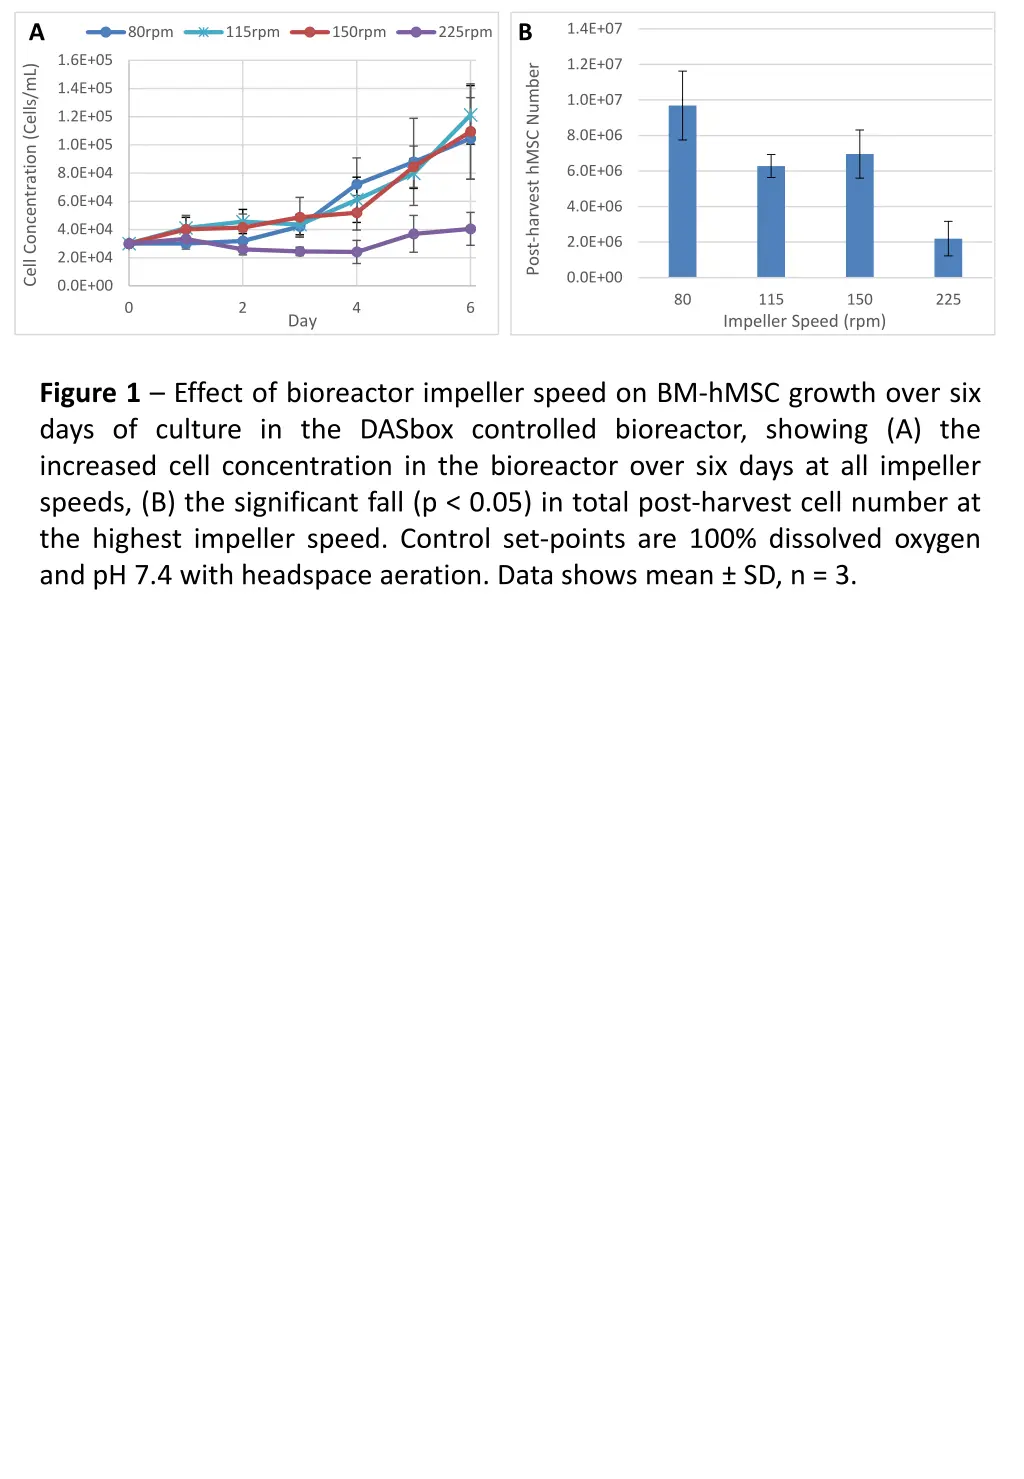
A B 1.4E+07 80rpm 115rpm 150rpm 225rpm 1.6E+05 1.2E+07 Post-harvest hMSC Number Cell Concentration (Cells/mL) 1.4E+05 1.0E+07 1.2E+05 8.0E+06 1.0E+05 6.0E+06 8.0E+04 6.0E+04 4.0E+06 4.0E+04 2.0E+06 2.0E+04 0.0E+00 0.0E+00 80 115 150 225 0 2 4 6 Day Impeller Speed (rpm) Figure 1 Effect of bioreactor impeller speed on BM-hMSC growth over six days of culture in the DASbox controlled bioreactor, showing (A) the increased cell concentration in the bioreactor over six days at all impeller speeds, (B) the significant fall (p < 0.05) in total post-harvest cell number at the highest impeller speed. Control set-points are 100% dissolved oxygen and pH 7.4 with headspace aeration. Data shows mean SD, n = 3.
A B 80RPM 115RPM 150RPM 225RPM 80RPM 115RPM 150RPM 225RPM 6 Lactate Dehydrogenase (U/L) 100 5 Total Protein (g/L) 80 4 60 3 40 2 20 1 0 0 0 2 4 6 0 2 4 6 Time in Culture (Days) Time in Culture (Days) Figure 2 Effect of impeller speed on A) the production of lactate dehydrogenase (LDH) and B) total protein concentration during microcarrier culture of BM-hMSCs in a controlled bioreactor. Showing no significant increase in LDH concentration or total protein at various impeller speeds, demonstrating low levels of cell damage during culture. Data shows mean SD, n = 3.
B A 6 4.0 3.5 Yield of Lactate from Glucose 5 Ammonia Production Rate 3.0 4 (pmol.cell-1.day-1) 2.5 (mol.mol-1) 3 2.0 1.5 2 1.0 1 0.5 0 0.0 80 115 150 225 80 115 150 225 Impeller Speed (rpm) Impeller Speed (rpm) Figure 3 Effect of bioreactor impeller speed on BM-hMSC metabolite flux over six days of culture in the DASbox controlled bioreactor, showing (A) per cell flux of ammonia and (B) yield of lactate from glucose. Control set-points are 100% dissolved oxygen and pH 7.4 with headspace aeration. Data shows mean SD, n = 3.
A 0.40 0.35 Specific Outgrowth Rate (day-1) 0.30 0.25 0.20 0.15 0.10 80 115 150 225 Pre- Post- spinners expansion Impeller Speed (rpm) B 18 17 Mean Cell Diameter ( m) 16 15 14 13 12 80 115 150 225 Pre- Post- spinners expansion Impeller Speed (rpm) C 30 28 CFU Efficiency (%) 26 24 22 20 18 16 80 115 150 225 Pre- Post- spinners expansion Impeller Speed (rpm) Figure 4 Post-harvest characteristics of BM-hMSCs from controlled microcarrier culture compared to spinner flasks [14]. Showing (A) increased outgrowth kinetics, (B) reduced mean cell diameter and (C) maintained CFU efficiency at all impeller speeds. Data shows mean SD, n = 3.
A Sparging with Pluronic F68 Sparging without Pluronic F68 Headspace 2.5E+05 hMSC Number (Cells.mL-1) 2.0E+05 1.5E+05 1.0E+05 5.0E+04 0.0E+00 0 1 2 3 Day 4 5 6 B Sparging with Pluronic F68 Sparging without Pluronic F68 Headspace 100 hMSC attachment (%) 80 60 40 20 0 0 1 2 3 4 5 6 Time in culture (days) Figure 5 Effect of sparging (VVM = 0.1) with and without PluronicTM F68 on BM-hMSC growth over six days of controlled microcarrier culture compared to headspace aeration. Showing (A) significantly increased growth rate with headspace aeration (p < 0.05), and (B) reduced BM-hMSC attachment in sparged culture, particularly with the addition of PluronicTM F68.. Control set- points are 115 rpm impeller speed, 25% dO2 concentration and pH 7.4. Data shows mean SD, n = 3.
A B 25 25 20 20 Glucose Consumption Rate Lactate Production Rate (pmol.cell-1.day-1) (pmol.cell-1.day-1) 15 15 10 10 5 5 0 0 Headspace Sparging with Pluronic F68 Sparging without Pluronic F68 Headspace Sparging with Pluronic F68 Sparging without Pluronic F68 C D 4.0 2.5 3.5 Yield of Lactate from Glucose Ammonia Production Rate 2.0 3.0 (pmol.cell-1.day-1) 2.5 1.5 (mol.mol-1) 2.0 1.0 1.5 1.0 0.5 0.5 0.0 0.0 Headspace Sparging with Pluronic F68 Sparging without Pluronic F68 Headspace Sparging with Pluronic F68 Sparging without Pluronic F68 Figure 6 Effect of sparging (VVM = 0.1) with and without PluronicTM F68 compared to headspace aeration on BM-hMSC metabolite flux over six days of controlled microcarrier culture . Showing (A) similar glucose consumption rate, (B) increased lactate production, (C) significantly increased ammonia production rate (p < 0.05) and (D) similar yield of lactate from glucose in sparged culture (AWN: Don't agree that yield of lactate from glucose is similar. I think it increases; and it does not seem to be clearly discussed in the text) Control set-points are 115 rpm impeller speed, 25% dO2 concentration and pH 7.4. Data shows mean SD, n = 3.
A B 30 1.4E+07 25 1.2E+07 Post-harvest hMSC Number 1.0E+07 20 CFU Efficiency (%) 8.0E+06 15 6.0E+06 10 4.0E+06 5 2.0E+06 0 0.0E+00 Headspace Sparging with Pluronic F68 Sparging without Pluronic F68 Headspace Sparging with Pluronic F68 Sparging without Pluronic F68 0.40 18 C D 0.35 17 Specific Outgrowth Rate (day-1) Mean Cell Diameter ( m) 0.30 16 0.25 15 0.20 14 0.15 13 0.10 12 Headspace Sparging with Pluronic F68 Sparging without Pluronic F68 Headspace Sparging with Pluronic F68 Sparging without Pluronic F68 Figure 7 Effect of sparging (VVM = 0.1) with and without PluronicTM F68 on BM-hMSC attachment and post-harvest characteristics after six days of controlled microcarrier culture compared to headspace aeration. Showing (A) significantly reduced harvest cell number (p < 0.05), (B) decreased CFU efficiency, (C) similar specific outgrowth rate and (D) significantly increased mean cell diameter in sparged culture (p < 0.05). Control set-points are 115rpm impeller speed, 25% dO2 concentration and pH 7.4. Data shows mean SD, n = 3.
Max Max specific energy dissipation rate (W/kg) Kolmogorov scale of turbulence ( m) Impeller rate (rpm) Culture volume (ml) dissipation rate/average dissipation rate1 Power number1 Reynolds number Impeller speed (s-1) 80 100 1.5 1440 1.33 0.016 90 18 115 100 1.5 18 2070 1.92 0.046 68 150 100 1.5 18 2700 2.50 0.103 56 225 100 1.5 18 4050 3.75 0.346 41 Table 1 Fluid dynamic characterisation of the DASGIP DASbox bioreactor platform at the various impeller speeds used in this study (impeller diameter of 0.03 m and a bioreactor diameter of 0.063 m). (Based on the procedure set out in Nienow et al. 2016 [17]).
A 80RPM 115RPM 150RPM 225RPM 6 5 Glucose Concentration 4 (mmol.L-1) 3 2 1 0 0 2 4 6 Time in Culture (Days) B 80RPM 115RPM 150RPM 225RPM 10 Lactate Concentration 8 (mmol.L-1) 6 4 2 0 0 2 4 6 Time in Culture (Days) C 80RPM 115RPM 150RPM 225RPM 1.0 Ammonia Concentration 0.8 0.6 (mmol.L-1) 0.4 0.2 0.0 0 2 4 6 Time in Culture (days) Supplementary figure 1 Effect of impeller speed on the live metabolite concentrations during BM-hMSC expansion in controlled microcarrier culture at 100% dO2 with headspace aeration. Showing (A) glucose, (B) lactate and (C) ammonia concentrations at various impeller speeds. Data shows mean SD, n = 3.
Headspace Sparging with Pluronic F68 Sparging without Pluronic F68 A B Headspace Sparging with Pluronic F68 Sparging without Pluronic F68 Lactate Dehydrogenase (U/L) Total Protein (g/L) 6 100 5 80 4 60 3 40 2 20 1 0 0 0 2 4 6 0 2 4 6 Time in Culture (Days) Time in Culture (Days) Supplementary figure 3 Effect of aeration method on the metabolite flux of BM-hMSCs in controlled microcarrier culture. Showing no significant increase in (A) LDH concentration or (B) total protein with various aeration methods, demonstrating low levels of cell damage during culture. Control set-points are 115rpm impeller speed, 25% dO2 concentration and pH 7.4. Data shows mean SD, n = 3.
Osteogenic 250 m Adipogenic 250 m Chondrogenic 250 m Impeller speed (rpm) 80 150 225 % co-expression of immunophenotye markers 96.50 0.14 96.80 0.28 95.80 0.14 Supplementary figure 2 - Verification of post-harvest immunophenotype and differential potential of BM- hMSCs used during this study in accordance with the ISCT minimum criteria.