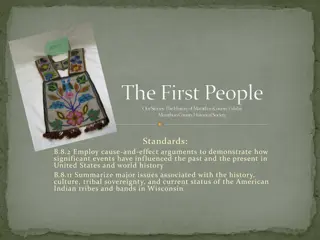
BIPOC Disparities and Challenges in Wisconsin
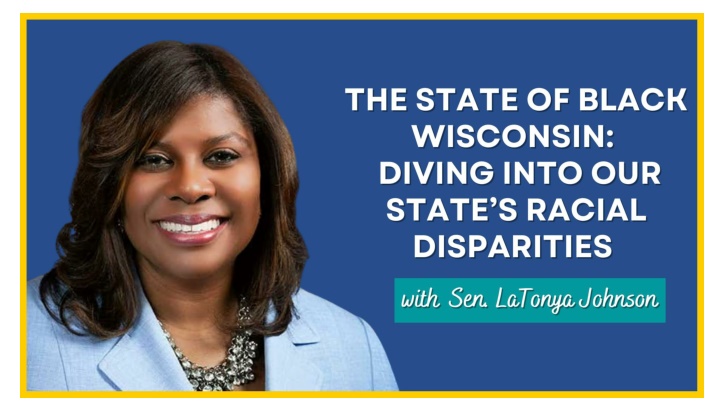
The data presented reflects the disparities and challenges faced by Black, Indigenous, People of Color (BIPOC) communities in Wisconsin, including issues in housing security and the criminal justice system. Highlighting the impact of social determinants of health, these insights aim to foster awareness and drive advocacy for systemic change.

Download Presentation

Please find below an Image/Link to download the presentation.
The content on the website is provided AS IS for your information and personal use only. It may not be sold, licensed, or shared on other websites without obtaining consent from the author.If you encounter any issues during the download, it is possible that the publisher has removed the file from their server.
You are allowed to download the files provided on this website for personal or commercial use, subject to the condition that they are used lawfully. All files are the property of their respective owners.
The content on the website is provided AS IS for your information and personal use only. It may not be sold, licensed, or shared on other websites without obtaining consent from the author.
E N D
Presentation Transcript
We know that for too long Black, Indigenous, People of Color (BIPOC) communities have been left behind and intentionally harmed by our policies and systems in place. In order for us to move forward, we must know the current landscape. By diving into some of the data about disparities and challenges affecting BIPOC prosperity, we hope to equip stakeholders with some of the tools needed to advocate for change.
SOCIAL DETERMINANTS OF HEALTH SOCIAL DETERMINANTS OF HEALTH Where Wisconsin is Currently All of the data that we will be discussing next are the result of many factors known as the social determinants of health. This includes social and economic disparities, lack of access and quality care, environmental quality, etc.
HOUSING SECURITY HOUSING SECURITY Where Wisconsin is Currently On a given day in 2020, Wisconsin had 4,515 people sleeping in places not meant for human habitation, and a total of 11,624 people stayed in emergency shelters. Of these, 4,866 were located in Brown, Dane, and Milwaukee counties. In 2018-19, 18,349 children attending Wisconsin public schools lacked a fixed, regular, and adequate nighttime residence. Wisconsin's housing shortage disproportionately impacts the lowest income households. Wisconsin has an estimated 188,100 households earning less than 30% of median income, but only 69,000 homes are considered affordable for those families. Black Wisconsinites are 11 times as likely to experience homelessness than their white counterparts. According to the 2021 point in time count, 58 percent of homeless Milwaukeeans are Black, despite African Americans making up just 38.7 percent of the city s total population. In contrast, 36.9 percent of homeless people in Milwaukee are white, yet white Americans account for 44.4 percent of the city s entire population.
CRIMINAL JUSTICE CRIMINAL JUSTICE Where Wisconsin is Currently Wisconsin imprisons Black residents at a higher rate than any other state in the country at a rate of 1 in 36 black adults. Black individuals comprise 41.3% of the Wisconsin prison population, but just 7% of the state s population and are imprisoned 12x times the rate of white Wisconsinites. There are currently 19,865 individuals in the care of Wisconsin Department of Corrections. Approx. 8,204 individuals are Black. A 2020 study by the Wisconsin Court System found that men of color, particularly Black and Native American men, are significantly more likely to receive prison sentences than their white counterparts 28% and 34% more likely, respectively, with white men 21% less likely than non- white men to receive a prison sentence.
CRIMINAL JUSTICE CRIMINAL JUSTICE Oakhill Correctional Institution Assisted Needs Facility for Males (geriatric correctional facility) in Oregon WI In 2017 Act 59, corrections was approved for $7,000,000 of borrowing to build a geriatric facility which would provide a 65 bed barrack, bunk style housing unit with 15 hospital beds and 50 standard beds will provide limited medical services for male inmates needing assistance with daily living activities. This facility is being created to address the rising number of inmates that need medical resources due to poor physical health, diminishing cognitive ability, and lack of mobility. Basically any impairments that would prevent a inmate from functioning completely independent. The institutional population has a high geriatric population with 7.7% of male inmates and 4.2% of females being 60 years of age or older as of July 1, 2020. Because of this fact the new facility is expected to fill it s 65 beds almost immediately upon opening its doors.
CRIMINAL JUSTICE: MENTAL HEALTH FACILITIES Wisconsin s Department of Health Services runs two mental health facilities Mendota Mental Health Institute in Madison and Winnebago Mental Health Institute Oshkosh. Mendota Mental Health Institute Is typically almost always used for individuals who have been committed as a result of a criminal proceeding, these individuals are known as forensic patients. However, they do have a unit for civil patients too. Forensic patients fall into one of three categories: 1. Individuals found not guilty of a crime by reason of mental disease or defect 2. Individuals who have been deemed not competent to stand trial for a criminal charge as a result of mental illness and for whom the court has ordered treatment to restore competency 3. Individuals who are undergoing evaluation to determine competency to stand trial
CRIMINAL JUSTICE: MENTAL HEALTH FACILITIES The DHS operates the Mendota Juvenile Treatment Center (MJTC) which is located on the Mendota Campus. The Juvenile treatment center is a Type 1 facility that provides psychiatric evaluations and treatment for male juveniles transferred from the juvenile correctional facility whose behavior is extremely disruptive and have not responded well to standard services or treatment. MJTC has staffed 29 beds and since 2016, the department has operated a 14-bed unit for forensic adults within the MJCT building in a separate space not used for juveniles in that program. Winnebago Mental Health Institute Typically deals with patients who are admitted under a civil process who have been deemed a danger to themselves or others as a result of mental illness or drug addiction. This can be done on an emergency basis, time-limited basis under an emergency detention, or long term basis known as civil commitment. The State also has Sand Ridge Secure Treatment Center (SRSTC) located in Mauston- This facility houses our state s civil commitment program for sexually violent person s. but since 2018, the Department has also operated units for forensic patients at Sand Ridge, using those spaces not needed for the sexually violent person s program. The Department has 2 units with 40 beds for forensic patients who would otherwise be on a waiting list for admission to Mendota. If we count all the beds including the 14 beds in MJTC, the 40 beds at Sand Ridge, Mendota has a total capacity of 313 beds for forensic patients.
CRIMINAL JUSTICE CRIMINAL JUSTICE Gov. Evers Proposed 2023-25 State Budget Raise the age for adult corrections from 17 to 18 Create a Community Reinvestment Fund from tax revenue generated by legalizing marijuana to fund mental health and substance use disorder services Earned Release Program Expansion Alternative to Revocation Expansion Earned Release Compliance Credit
PERSONAL SAFETY PERSONAL SAFETY Where Wisconsin is Currently Every year, an average of 177 people in Wisconsin die by gun homicides and 509 are wounded by gun assaults a rate of 3.3 homicides and 8.8 assaults per 100,000 people. Wisconsin has the 33rd highest rate of gun homicides and gun assaults in the US. In Wisconsin, 74% of all homicides involve a gun, compared to 75% nationwide. Gun homicides, assaults, and shootings by police cost Wisconsin $2.9 billion each year. Wisconsin has the 39th-highest cost of gun homicides, assault injuries, and shootings by police in the US at $514 per person. In 2020, Milwaukee police confiscated more than 3,000 guns last year during traffic stops and domestic dispute calls-- an 18% increase from 2019." Unfortunately, 2021 was the worst year for gun violence in decades, surpassing even the high levels last year. There were 197 homicides in Milwaukee last year, surpassing the record of 190 homicides set in 2020, just the year before. 90% of these homicides were shootings. In Madison, between 2019 and 2020, shots fired incidents increased from 144 to 250; Homicides almost tripled from four to 11.
PERSONAL SAFETY PERSONAL SAFETY Gov. Evers Proposed 2023-25 State Budget $60 million to create a Civil Legal Assistance Grant Program $20 million for after-school programming to keep kids safe and engaged Universal background checks for firearm sales $7,500,000 GPR annually to the Medical College of Wisconsin for their Wisconsin Community Safety Fund, which supports local, evidence-informed activities that enhance the safety and wellbeing of children, youth and families throughout Wisconsin and aim to prevent violence. $60 million for traffic calming grants
MILWAUKEE CITYWIDE PART I CRIME MILWAUKEE CITYWIDE PART I CRIME 21-22 % Change Offense 2017 2018 2019 2020 2021 2022 Homicide 119 99 97 190 194 214 11% Rape 435 502 468 491 496 480 -5% Robbery 2,950 2,317 1,981 2,085 2,077 1,803 -13% Aggravated Assault 6,101 5,825 5,745 7,238 7,471 7,127 -5% Human Trafficking 28 56 57 30 12 29 142% Total Violent Crime 9,633 8,799 8,348 10,034 10,250 9,653 -5% Burglary 5,718 4,432 3,691 3,462 2,824 2,333 -18% Theft 10,560 8,455 7,986 8,547 10,187 8,736 -15% Auto Theft 5,448 4,652 3,487 4,508 10,470 8,098 -23% Arson 315 263 200 288 247 255 4% Total Property Crime 22,041 17,802 15,364 16,805 23,728 19,422 -18% Total Part I Crime* 31,330 26,398 23,548 26,616 33,590 28,811 -15% 21-22 % Change Offense 2017 2018 2019 2020 2021 2022 Non-Fatal Shootings 559 476 452 764 871 877 0% Carjackings 409 385 357 375 371 397 7% Part I crime data was obtained from the DCS Fact table and counts incidents of robbery, burglary, theft, auto theft and arson and victims of rape, aggravated assault and human trafficking for the time period of January 1-December 31, 2017-2022. Homicide and non-fatal shooting data was obtained from the OMAP Homicide and Non-Fatal Shooting databases and counts victims for the same time period. Carjacking data was obtained from the OMAP Carjacking database and counts distinct incidents for the same time period. *Totals may not sum since an incident may contain more than one offense.
CLEARANCE RATES CLEARANCE RATES Offense 2017 2018 2019 2020 2021 Homicides 78% 76% 77% 55% 50% Non-Fatal Shootings 39% 44% 50% 40% 35% Offense 2019 2020 2021* Homicide 77% 55% 50% Rape 46% 41% 35% Robbery 24% 23% 27% Aggravated Assault 42% 38% 44% Human Trafficking 58% 50% 58% Burglary 7% 9% 9% Auto Theft 3% 2% 3% Arson 17% 15% 12% Carjackings 35% 39% 34%
GUN RECOVERIES GUN RECOVERIES Work Location 20-21 % Change 2017 2018 2019 2020 2021 Citywide Guns Recovered by Police Activity Type District 1 35 57 50 72 74 3% District 2 227 186 185 172 285 66% 2020 2021 2,100 District 3 303 251 249 306 336 10% 1,947 District 4 284 256 207 277 338 22% District 5 609 726 497 622 664 7% District 6 89 97 93 108 154 43% District 7 433 419 379 442 394 -11% 604 515 CIB 354 688 866 729 906 953 5% 231 251 190 93 91 Other** 85 50 232 192 81 -58% Incident Search Warrant Subject StopTraffic Stop Other Activities* % Evidence 86% 86% 87% 87% 89% -- Citywide 2,753 2,908 2,621 3,097 3,279 6% In 2021, 89% (2,917) guns recovered were evidence guns. Gun recovery data was obtained from WinACE and is based on the date prepared for the time period of January 1-December 31, 2017-2021. Evidence guns exclude guns taken for safekeeping. Police activities include (i.e. traffic stops, search warrants, subject stops, etc.) and location categories include (i.e. vehicle, residence, business, etc.) and are obtained from a manual review of the narrative reports and may contain a margin of error. *Other activities includes search (probable cause & consent), turned in, other and safekeeping. Incident category includes investigations, complaints, accidents and more.
CITYWIDE GUN VIOLENCE CITYWIDE GUN VIOLENCE Stolen Guns Stolen Guns Guns taken in offenses increased by 125% in 2021 compared to 2019 Crime 2019 2020 2021 19-21 % Change The largest increase occurred in motor vehicle theft incidents. Theft from Vehicle 316 582 841 166% Motor Vehicle Theft 17 21 64 276% Gun Recovery In 2021, MPD recovered 2,917 guns compared to 2,272 in 2019 (28 % increase) Burglary 110 133 120 9% Total* *Totals may not sum since incidents may have more than one offense 438 722 985 125% Work locations with the largest percent increase in gun recoveries include District 1 (133%) and District 6 (122%) Felon in Possession of Firearm Arrests FIPOF Arrests In 2021, MPD arrested 932 individuals for felon in possession of a firearm. Of those, 10% were individuals arrest for adjudged delinquent possessing firearm. Arrests 2019 2020 2021 19-21% Change FIPOF Total 709 786 932 31% Adjudged Delinq. 49 59 94 92% The median age for arrests of adjudged delinquent possessing firearm is 19 years old Data obtained from the Milwaukee Police Department Office of Violence Prevention in February 2022
CITYWIDE GUN VIOLENCE CITYWIDE GUN VIOLENCE Firearm Related Violence Crime Firearm Related Violent Crime Firearm Related Violence Crime 19-21 % Change 2019 2020 2021 In 2021, firearm related violent crime increased 58% (5,769) from (3,656 compared to 2019. Homicide 79 168 180 128% Total 97 190 193 99% 56% of violent crimes involved a firearm in 2021, while in 2019, less than half involved firearms. Robbery 1,019 1,137 1,182 16% Total 1,980 2,084 2,079 5% The percentage of firearm related homicides increased from 81% to 93% from 2019 to 2021. Similar increases are found among aggravated assaults and robbery. Aggravated Assault 2,512 3,969 4,369 74% Total 5,747 7,237 7,502 31% Firearm Related Violent Part I Crime Total* In 2021, firearm related homicides increased 128% (180) from (79) compared to 2019. 3,656 5,304 5,769 58% District 1 and District 7 had over 70% increases for firearm related part 1 crimes. Violent Part I Crime Total 8,349 10,032 10,289 23% Non-fatal shootings increased 93% in 2021 (872) from (452) compared to 2019. Non-Fatal Shootings 452 764 872 93% Carjacking 195 237 245 26% In 2021, the primary factor of argument/fight of non-fatal shootings increased 106%. Total 357 375 371 4% *Violent crime totals include firearm related rape and human trafficking, not listed above. Totals may not sum since incidents may have more than one offense. Data obtained from the Milwaukee Police Department Office of Violence Prevention in February 2022
CITYWIDE CRIME DEMOGRAPHICS CITYWIDE CRIME DEMOGRAPHICS Firearm Related Violence Crime Demographics 2019 2021 | Homicide, Robbery, Aggravated Assault Victim Suspect Firearm Related Crime Demographics Race/Ethnicity Male Female Total Male Female Total Homicide Victims: Median age: 29/Juveniles: 43 (10%) American Indian/ Alaska Native 34 29 63 23 7 30 Homicide Suspects: Median Age: 25/Juveniles: 21 (7%) Asian 152 73 225 56 5 61 Black/African American Robbery and Aggravated Assault Victims: Median age: 29/Juveniles: 1,869 (13%) 5,484 5,064 10,548 5,656 1,581 7,237 Hispanic/ Latino 1,009 632 1,641 699 185 884 Robbery and Aggravated Assault Suspects: Median age: 29/Juveniles: 406 (5%) Native Hawaiian/ Pacific Islander 3 7 10 2 3 5 Homicide, Robbery, Aggravated Assault (Top 3): Victims: 74% Black/African American, 13% White, 11% Hispanic/Latino Suspect: 81% Black/African American, 10% Hispanic/Latino, 8% White White 1,139 692 1,831 492 175 667 Unknown 25 8 33 3 1 4 Total 7,846 6,505 14,351 6,391 1,957 8,888 Data obtained from the Milwaukee Police Department Office of Violence Prevention in February 2022
CITYWIDE CITYWIDE DISPATCHED CALLS FOR SERVICE DISPATCHED CALLS FOR SERVICE Priority Level 20-21 % Change 2017 2018 2019 2020 2021 Priority 1 64,278 58,835 63,100 75,247 75,486 0% Priority 2 102,437 110,888 108,110 102,009 105,169 3% Priority 3 71,868 70,171 77,654 76,488 83,324 9% Priority 4 14,828 15,628 16,040 17,707 15,752 -11% Emergency 115 77 65 79 88 11% Total Calls 253,526 255,599 264,969 271,530 279,819 3% Dispatched calls for service data obtained from the Computer Aided Dispatch System (CAD) and counts distinct calls for the time period of January 1 December 31, 2017-2021. Calls exclude proactive activity, DPR, training units and training calls, calls where a primary unit was not assigned, priority 5 calls, misdials, and calls with a disposition type of MFD, MCSO, DRU, and CANC.
CITYWIDE DISPATCHED CITYWIDE DISPATCHED CALLS FOR SERVICE CALLS FOR SERVICE Firearm Related Dispatched Calls for Service Firearm Related Calls for Service In 2021, firearm related call types increased 47% (16,750) from (11,411) compared to 2019. Firearm related calls for service account for 4%-6% of all calls for service. While adult arrests increased 17% juveniles increased 123% in 2021 compared to 2019 for firearm related calls for service. Call Type 2019 2020 2021 19 21 % Change Subject w/ gun 5,384 7,012 7,761 44% Shots Fired 5,270 7,618 7,586 44% Shooting 757 1,237 1,403 85% ShotSpotter ShotSpotter activations increased 130% in 2021 (17,002) from (7,378) compared to 2019. ShotSpotter activations are identified with additional characteristics including activations with fully automatic weapons or activations with multiple shooters. Full auto activations increased 1,607% in 2021 compared to 2019, while multiple shooter activations increased 214% for the same time period. Data obtained from the Milwaukee Police Department Office of Violence Prevention in February 2022
CITYWIDE CRASHES CITYWIDE CRASHES 20-21 % Change Category 2017 2018 2019 2020 2021 Total Fatal Crashes 64 57 51 78 66 -15% Total Hit & Runs 4,961 5,722 6,033 6,081 7,124 17% Total Crashes 14,910 16,876 18,204 16,143 17,520 9% Data was obtained from the TraCS 10 data system and counts distinct crash reports filed during the time period of January 1 December 31, 2017-2021. Crash fatalities were obtained from the OMAP Fatal Crash database and counts victims for the same time period.
RECKLESS DRIVING RECKLESS DRIVING 20-21 % Change Category 2017 2018 2019 2020 2021 CAD Calls Reckless Vehicle 2,962 3,269 2,722 2,175 2,072 -5% Arrests 415 548 628 579 725 25% Reckless Driving Citations 3,717 4,210 4,582 3,798 4,873 28% Reckless Driving Citations with Speeding 15,537 13,890 13,852 17,322 29,252 69% Calls for service data was obtained from the Computer Aided Dispatched System (CAD) and counts distinct calls for the time period of January 1 - December 31, 2017-2021. Arrest data was obtained from TriTech JailInform and counts distinct arrests for the same time period above. Citations were obtained from TraCS 10 and counts distinct citations for the same time period above. Reckless driving citations include "346.46(1)", "346.04(2)", "346.57(2)", "346.04(3)", "346.62(2)", "346.94(12)", "346.89(1)", "346.57(3)", "346.39(1)", "346.04(2t)", "346.62(4)", "346.94(2)", "346.62(3)", "346.59(1)", "346.94(1)", "346.89(3)(a)", "346.595(5)", "346.89(5)". Arrests use the citations listed above.
TRAFFIC SAFETY UNIT TRAFFIC SAFETY UNIT Citation Traffic Safety Unit (TSU) All Other Work Locations % Issued By Traffic Safety Unit Total Citations Category Speeding 10,871 10,479 21,350 51% Operating While Intoxicated 72 1,004 1,076 7% Driver's License 3,462 5,162 8,624 40% Traffic Sign and Signal 2,067 2,806 4,873 42% The Traffic Safety Unit was initiated on February 24, 2021 Data was obtained from the TraCS 10 data system and counts distinct citations issued during the time period of February 24 December 31, 2021. Traffic Safety Unit (TSU) personnel identified by PeopleSoft ID for assigned members. 22
MOTOR VEHICLE THEFTS & RECOVERIES MOTOR VEHICLE THEFTS & RECOVERIES 20-21 % Change Category 2017 2018 2019 2020 2021 Motor Vehicle Thefts (Attempted & Completed) 5,448 4,652 3,488 4,508 10,481 132% Motor Vehicle Thefts (Completed Only) 4,786 4,099 3,220 4,163 8,645 108% Stolen Vehicles Recovered 4,433 3,428 2,788 3,678 7,723 110% % of Stolen Vehicles Recovered 93% 84% 87% 88% 89% +1% Motor vehicle theft data was obtained from the DCS Fact Table and counts distinct incidents for the time period of January 1 - December 31, 2017-2021. Vehicle recovery data was obtained from Tiburon Records Management System for the time period of January 1, 2017 April 30, 2018 and TriTech Records Management System for the time period of May 1, 2018 December 31, 2021. The percentage of stolen vehicles recovered is calculated by dividing the number of stolen vehicles by the number of completed motor vehicle thefts.
SHOTSPOTTER ACTIVATIONS SHOTSPOTTER ACTIVATIONS 20-21 % Change Boundary Area 2017 2018 2019 2020 2021 North Boundary 7,825 5,657 6,274 11,790 15,421 31% South Boundary 1,241 1,237 1,106 1,530 1,581 3% Total 9,066 6,894 7,380 13,320 17,002 28% ShotSpotter data was obtained from the ShotSpotter Insight Portal for the time period of January 1-December 31, 2017-2021 and counts distinct ShotSpotter activations and excludes incidents determined by ShotSpotter to be non-gunfire/firework.
DISPARITIES IN HEALTH DISPARITIES IN HEALTH Where Wisconsin is Currently Wisconsin has consistently been ranked the worst place in America to raise a Black child. Black babies in Wisconsin are 3x as likely to die before their first birthday as compared to white babies. Specifically, the infant mortality rate in Wisconsin is 15 deaths per 1000 live births for Black babies compared to just 5 deaths per 1000 live births for white babies. For zip code 53206it s 29 deaths per 1000 live births. These alarming numbers of infant mortality makes Wisconsin the highest of any state in the nation, at 30% above the nationwide average of 10.5 deaths per 1,000 live births. Based on 2018 CDC data. Black mothers experience 1.75x the risk of significant complications from labor or delivery facing white mothers, and 5x the risk of dying in childbirth or from complications.
DISPARITIES IN HEALTH DISPARITIES IN HEALTH Gov. Evers Proposed 2023-25 State Budget Post-partum BadgerCare coverage for new moms for 12 months. $5.67 million and 2.0 FTE GPR positions to support grants for maternal and infant mortality prevention, expansion of fetal and infant mortality review teams, a grief and bereavement resource for families who have lost a fetus or infant, and technical assistance. Birth-to-3 eligibility for lead-poisoned children who have a positive blood lead test above 3.5 micrograms per deciliter Strengthen Wisconsin s Paid Family and Medical Leave options by allocating more than $243 million to the creation of a Paid Family and Medical Leave program that would enable workers to be eligible for 12 weeks of leave by 2025. This is a significant step towards improving maternal and child health, as paid leave decreases rates of infant mortality and lowers levels of stress for parents.
DISPARITIES IN HEALTH DISPARITIES IN HEALTH Gov. Evers Proposed 2023-25 State Budget Expand home visiting services to approximately 24 additional counties and Tribes. Create a Medicaid community health benefit that invests $25,500,000 all funds over the biennium for nonmedical services to reduce and prevent health disparities. Services include housing referrals, nutritional mentoring, stress management, and other services that would positively impact an individual s economic and social condition. This provision will help to remove barriers to healthy pregnancies. Remove sales tax for breastpump equipment. BadgerCare coverage for Doulas. $200 million GPR for Safe Drinking Water Loan Program for the replacement of lead service lines. Gov. Evers also recommends authorizing an additional $372 million in revenue bonds to fund the state match requirements and additional loans in the Safe Drinking Water Loan Program and Clean Water Fund Program.
DISPARITIES IN HEALTH: LEAD DISPARITIES IN HEALTH: LEAD Lead pipes like the ones in Flint threaten 70,000 residences in Milwaukee, 10,000 in Racine, 8,000 in West Allis, 6,500 in Manitowoc, 7,000 in Kenosha, almost 2,000 in Green Bay and 3,000 in Shorewood. In fact, the children in the Cities of Milwaukee (8.6%) and Watertown (8.4%), Racine and Menasha have a greater incidence of lead poisoning than the Flint children (4.9%), as do our the counties of Buffalo, Green Lake, Pepin, Richland and Rock.
DISPARITIES IN HEALTH: DISPARITIES IN HEALTH: CHRONIC ILLNESS CHRONIC ILLNESS Where Wisconsin is Currently The CDC reports that in 2018, 6.8% of non-Hispanic white adults in Wisconsin were diagnosed with diabetes, compared to 12.5% of Black adults and 12.3% of Hispanics. In Wisconsin, Black women are 7x as likely as White women to die from a premature stroke (before age 65), and Black men are at 4x the risk of White men to die from a premature stroke. CDC data compiled by the Kaiser Family Foundation indicates that Wisconsin has the third-highest racial disparity in the rates of death by stroke in the country.
DISPARITIES IN HEALTH: DISPARITIES IN HEALTH: LIFE EXPECTENCY LIFE EXPECTENCY Wisconsin state death records indicate that White residents live an average of 15 years longer than Black residents. Disparities in Life Expectancy at Birth in Wisconsin by Race, 2018: White Age 76 Asian American Age 65 Native American Age 62 Black Age 61 All Races Age 75
DISPARITIES IN HEALTH: DISPARITIES IN HEALTH: SEXUAL HEALTH SEXUAL HEALTH Where Wisconsin is Currently The CDC identifies HIV/AIDS, sexually-transmitted diseases (STD s) and tuberculosis as other health conditions that show significant racial disparities. In Wisconsin, Black residents represent just 7% of the population but account for 38% of AIDS deaths; the AIDS death rate among white residents is less than one twelfth as high as the rate among Black residents, this is the 47th largest White-Black disparity, by state in the nation. The CDC also reports that Black residents diagnosed with HIV are less likely than other racial groups to receive care. Chlamydia and Gonorrhea also have large racial disparities. In Wisconsin Black residents have 10x s the risk of white residents of contracting chlamydia; only Pennsylvania has a larger disparity. Gonorrhea in Wisconsin affects Black people at 24.8 times the rate among white residents. This is three times the national average and is the largest disparity in the country.
OPPORTUNITY AND SCHOOL FUNDING OPPORTUNITY AND SCHOOL FUNDING Where Wisconsin is Currently Nearly 90% of Wisconsin's African American population lives in the following six counties, all of which are located in Southeastern or Southern Wisconsin: Milwaukee, Dane, Racine, Kenosha, Rock, and Waukesha. When looking at African Americans as a percent of the total county population, Milwaukee County tops this list, with 25.6 percent. In Wisconsin, while 1 percent of Wisconsin s white children live in high poverty areas 35 percent of African-American children and 18 percent of Latino children do. Black children make up about 9% of total Wisconsin public school students (Hispanic students is approx. 13%). 43.7% of Wisconsin public school students are economically disadvantaged. 86.5% of MPS students are economically disadvantaged.
OPPORTUNITY AND SCHOOL FUNDING OPPORTUNITY AND SCHOOL FUNDING Where Wisconsin is Currently In 2019, Wisconsin s graduation rate for white students was 92.7%, compared to a graduation rate of 71% for Black students. This gap in graduation rates for white and Black students is the largest in the country. Wisconsin also had the 47th highest gap between Black and white students in its share of adults with either a high school or bachelor s degree. Since 2000-01, the number of bilingual pupils in the state has increased by approximately 78%, however, the appropriation for bilingual-bicultural aid increased by only 4%, from $8,291,400 GPR in 2000-01 to $8,589,900 in 2019-20.
OPPORTUNITY AND SCHOOL FUNDING OPPORTUNITY AND SCHOOL FUNDING Gov. Evers Budget 2023-25 Proposal $2.6 billion increase in general and categorical aids for our K-12 schools, a combined increase of $1,000 per pupil while keeping the gross school levy increase below 1% Expand "Bucky's Promise" so WI students with household income of less than $60,000 can attend any UW school tuition-free. $120 million to fully fund school breakfast and lunches for all children. More than $1 billion for special education aid to schools, bringing reimbursement for special education up to 60% in both years.
OPPORTUNITY AND SCHOOL FUNDING OPPORTUNITY AND SCHOOL FUNDING Gov. Evers 2023-25 Budget Proposal $10 million in FY 2024-25 for the Milwaukee Math Partnership to improve math proficiency and professional development for current and aspiring Milwaukee teachers. $6.5 million for driver s education for students from low-income families. $22.4 million more over two years for English-language learners in public K-12 schools In-state tuition for all graduates of Wisconsin high schools, regardless of their documentation status
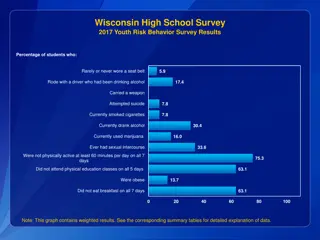
MENTAL HEALTH MENTAL HEALTH Where Wisconsin is Currently Between 2016 and 2019, 14.9% of Wisconsin youth ages 12-17 reported a major depressive episode in the past year. During the same time period, 12.1% of young adults aged 18-25 in Wisconsin reported having had serious thoughts of suicide in the past year. Wisconsin's 2019 Youth Risk Behavior Survey found that of the pupils surveyed, 49.0% reported high levels of anxiety, 28.5% indicated depression, and 18.5% reported that they had engaged in self-harm over the previous twelve months. Source: Wisconsin Office of Children s Mental Health
MENTAL HEALTH MENTAL HEALTH Source: Wisconsin Office of Children s Mental Health
MENTAL HEALTH MENTAL HEALTH Gov. Evers Proposed 2023-25 State Budget: 2023 is The Yearof Mental Health $500 million total increases to expand access to mental and behavioral health. $996,400 annually in Youth Crisis Stabilization Facilities Funding, ongoing state support for the three Youth Crisis Stabilization Facilities $270 million in funding for student mental health programs and support professionals. $3,004,400 for the 988 Suicide & Crisis Lifeline Support to cover operating costs of the state s 988 Suicide & Crisis Lifeline call center Provide nearly $11 million for Medicaid to reimburse schools for telehealth origination costs. Wisconsin After 3 Program - Increase funding to the Boys and Girls Clubs by $500,000 TANF funding in each year for the Wisconsin After 3 program to improve the literacy skills and math proficiency for low- income children. Additionally, provide $1,300,000 GPR annually to support youth mental health and substance use prevention.