Blood Analysis and Mitochondrial Function in Genetic Mouse Models
This study explores blood parameters and mitochondrial function in Phd2 mutant mice, analyzing factors such as red and white blood cell counts, hemoglobin levels, and gene expression related to glycolysis and lactate production. The research delves into the implications of Phd2 mutation on hematological characteristics and muscle mitochondrial content. Detailed findings are presented through blood analysis data and mitochondrial DNA quantification in different muscle types.

Download Presentation

Please find below an Image/Link to download the presentation.
The content on the website is provided AS IS for your information and personal use only. It may not be sold, licensed, or shared on other websites without obtaining consent from the author.If you encounter any issues during the download, it is possible that the publisher has removed the file from their server.
You are allowed to download the files provided on this website for personal or commercial use, subject to the condition that they are used lawfully. All files are the property of their respective owners.
The content on the website is provided AS IS for your information and personal use only. It may not be sold, licensed, or shared on other websites without obtaining consent from the author.
E N D
Presentation Transcript
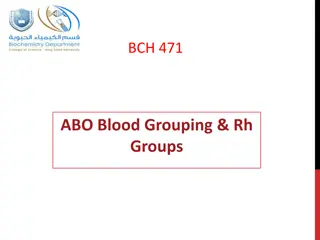
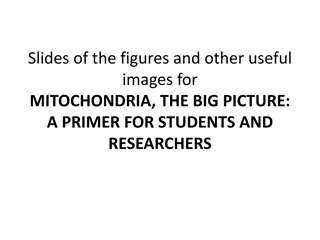
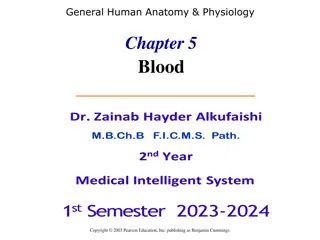
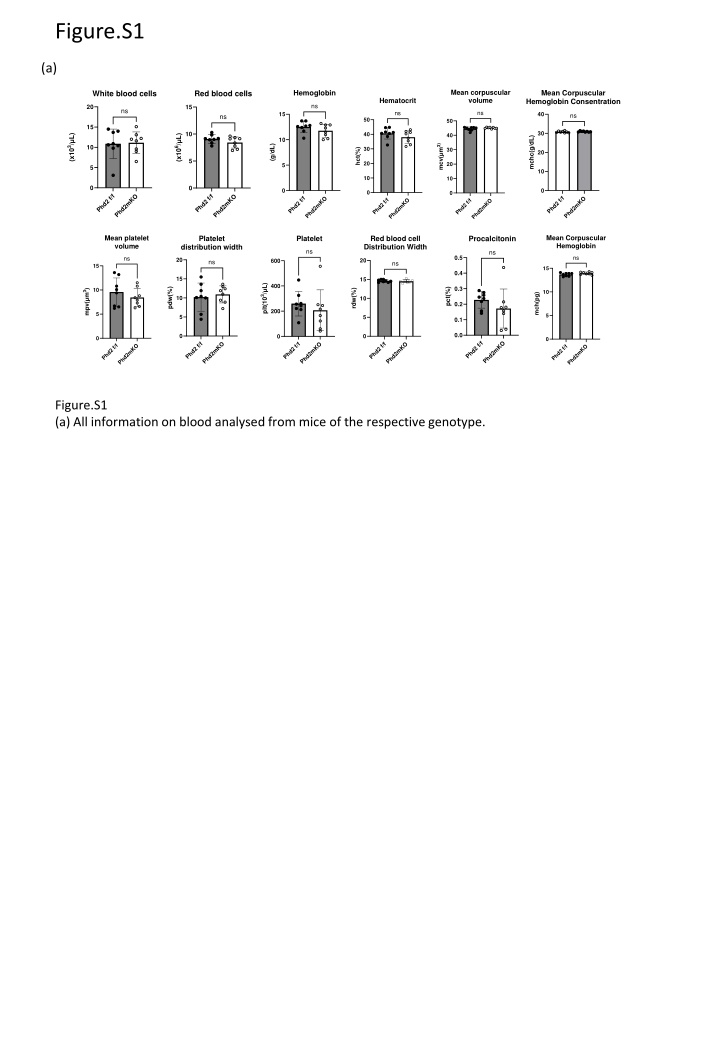
Figure.S1 (a) Mean corpuscular volume Hemoglobin Mean Corpuscular Hemoglobin Consentration White blood cells Red blood cells Hematocrit ns 20 15 ns ns ns 15 40 ns ns 50 50 15 30 10 40 40 (x103/ L) (x106/ L) mchc(g/dL) 10 mcv( m3) (g/dL) 10 30 30 hct(%) 20 5 20 20 5 5 10 10 10 0 0 0 0 0 0 Phd2 f/f Phd2mKO Phd2 f/f Phd2mKO Phd2 f/f Phd2 f/f Phd2mKO Phd2mKO Phd2 f/f Phd2mKO Phd2 f/f Phd2mKO Mean Corpuscular Hemoglobin Mean platelet volume Platelet Red blood cell Distribution Width Platelet Procalcitonin distribution width ns ns ns 0.5 ns 20 20 600 ns ns 15 15 0.4 15 15 400 plt(103/ L) 0.3 pdw(%) pct(%) 10 rdw(%) mpv( m3) 10 mch(pg) 10 10 0.2 200 5 5 5 5 0.1 0.0 0 0 0 0 0 Phd2 f/f Phd2mKO Phd2 f/f Phd2mKO Phd2 f/f Phd2mKO Phd2 f/f Phd2mKO Phd2 f/f Phd2mKO Phd2 f/f Phd2mKO Figure.S1 (a) All information on blood analysed from mice of the respective genotype.
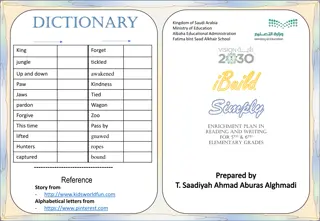
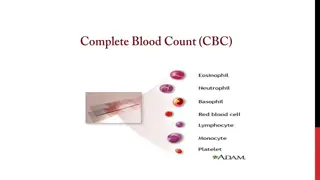
Figure.S3 Soleus (a) (b) 80 SDH positive fiber ratio (%) ns 60 40 20 Phd2 mKO Phd2 f/f 0 Phd2mKO Phd2f/f (c) mtDNA SOL mtDNA GC mtDNA TA ns ns ns 3 2.0 6 1.5 mtDNA/nDNA mtDNA/nDNA 4 2 mtDNA/nDNA 1.0 2 1 0.5 0 0 0.0 -2 Phd2mKO Phd2f/f Phd2mKO Phd2f/f Phd2mKO Phd2f/f Figure.S3 (a) Staining diagram of succinate dehydrogenase (SDH) activity in SOL. (b) Percentage of myofibres with active SDH in SOL. (c) Comparison of mitochondrial content in SOL, TA and GC by quantification (mitochondrial DNA/nuclear DNA).
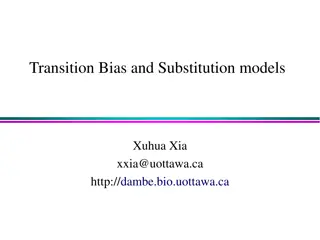
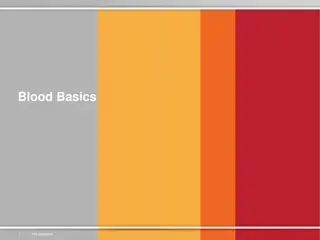
Figure.S4 (a) LDHA/ -actin ns LDHB/ -actin ns PGK1/ -actin ns PDK1/ -actin GLUT4/ -actin MCT1/ -actin MCT2/ -actin ns MCT4/ -actin GLUT1/ -actin 1.5 2.5 1.5 3 1.5 5 3 1.5 1.5 Gene expression(a.u.) Gene expression(a.u.) Gene expression(a.u.) Gene expression(a.u.) Gene expression(a.u.) Gene expression(a.u.) Gene expression(a.u.) Gene expression(a.u.) Gene expression(a.u.) 2.0 4 1.0 1.0 2 1.0 2 1.0 1.0 1.5 3 1.0 2 0.5 0.5 1 0.5 1 0.5 0.5 0.5 1 0.0 0.0 0.0 0 0.0 0 0 0.0 0.0 Phd2 f/f Phd2 mKO Phd2 f/f Phd2 mKO Phd2 f/f Phd2 mKO Phd2 f/f Phd2 mKO Phd2 f/f Phd2 mKO Phd2 f/f Phd2 mKO Phd2 f/f Phd2 mKO Phd2 f/f Phd2 mKO Phd2 f/f Phd2 mKO (b) LDHA/ -actin LDHB/ -actin ns PGK1/ -actin PDK1/ -actin ns GLUT1/ -actin ns GLUT4/ -actin ns MCT1/ -actin MCT2/ -actin ns MCT4/ -actin ns 1.5 8 10 2.5 4 3 4 ns 2.0 2.0 ns ns Gene expression(a.u.) Gene expression(a.u.) Gene expression(a.u.) Gene expression(a.u.) Gene expression (a.u.) Gene expression (a.u.) Gene expression (a.u.) Gene expression (a.u.) Gene expression (a.u.) 8 2.0 6 3 3 1.5 1.5 1.0 6 1.5 2 4 4 1.0 2 2 1.0 1.0 2 0.5 2 0.5 1 1 1 0.5 0.5 0 0 0.0 0.0 -2 -2 -0.5 0 0 0 0.0 0.0 Phd2 f/f Phd2 mKO Phd2 f/f Phd2 mKO Phd2 f/f Phd2 mKO Phd2 f/f Phd2 mKO Phd2 f/f Phd2 mKO Phd2 f/f Phd2 mKO Phd2 f/f Phd2 mKO Phd2 f/f Phd2 mKO Phd2 f/f Phd2 mKO (c) LDHA/ -actin LDHB/ -actin ns PGK1/ -actin ns PDK1/ -actin ns GLUT1/ -actin ns GLUT4/ -actin ns MCT1/ -actin ns MCT2/ -actin ns MCT4/ -actin ns 2.5 1.5 2.5 2.0 2.0 3 2.0 2.0 2.5 Gene expression (a.u.) Gene expression(a.u.) Gene expression(a.u.) Gene expression(a.u.) Gene expression(a.u.) Gene expression (a.u.) Gene expression(a.u.) Gene expression(a.u.) Gene expression(a.u.) 2.0 2.0 2.0 1.5 1.5 1.5 1.5 1.0 2 1.5 1.5 1.5 1.0 1.0 1.0 1.0 1.0 1.0 1.0 0.5 1 0.5 0.5 0.5 0.5 0.5 0.5 0.5 0.0 0.0 0.0 0.0 0.0 0 0.0 0.0 0.0 Phd2 f/f Phd2 mKO Phd2 f/f Phd2 mKO Phd2 f/f Phd2 mKO Phd2 f/f Phd2 mKO Phd2 f/f Phd2 mKO Phd2 f/f Phd2 mKO Phd2 f/f Phd2 mKO Phd2 f/f Phd2 mKO Phd2 f/f Phd2 mKO (d) PDK1/ -actin ns LDHA/ -actin LDHB/ -actin ns PGK1/ -actin 2.0 1.5 1.5 1.5 Gene expression(a.u.) Gene expression(a.u.) Gene expression(a.u.) Gene expression(a.u.) 1.5 1.0 1.0 1.0 1.0 0.5 0.5 0.5 0.5 0.0 0.0 0.0 0.0 Phd2 f/f Phd2 mKO Phd2 f/f Phd2 mKO Phd2 f/f Phd2 mKO Phd2 f/f Phd2 mKO Figure.S4 mRNA transcript levels of genes related to glycolysis and lactate production (LDHA, LDHB, PGK1, PDK1, GLUT1, GLUT4, MCT1, MCT2, MCT4) measured in GC and liver and in samples immediately after endurance running test. (a) mRNA transcript levels in GC muscle under normal conditions. (b) mRNA transcript levels in liver under normal conditions. (c) mRNA transcript levels in GC muscle immediately after endurance running test. (d) mRNA transcript levels in the liver immediately after the endurance running test.
Figure.S5 (a) Forward Reverse Phd2 5'-CAAATGGAGATGGAAGATGC-3' 5'-TCAACTCGAGCTGGAAACC-3' Cre 5'-GATATCTCACGTACTGACGG-3' 5'-TGACCAGAGTCATCCTTAGC-3' LDHA 5'-AAGTCTTCCCCGTGTCCTAG-3' 5'-CCACACCATCTCAACACCAC-3' LDHB 5'-CTAAGCACCGTGTGATTGG-3' 5'-ATTCAGTTCCTGGAGGGAG-3' PGK1 5'-TGGATGAGGTGGTGAAAGCC-3' 5'-GCACAGCAAGTGGCAGTGTC-3' PDK1 5'-CTGTGATACGGATCAGAAACCG-3' 5'-TCCACCAAACAATAAAGAGTGCT-3' GLUT1 5'-CCCCCCAGAAGGTTATTGAG-3' 5'-CCAACAGGTTCATCATCAGC-3' GLUT4 5'-CTGTAACTTCATTGTCGGCATGG-3' 5'-AGGCAGCTGAGATCTGGTCAAAC-3' MCT1 5'-TGGTTGTCTGTCTGGTTGC-3' 5'-CAGTGGTCGCTTCTTGTAG-3' MCT2 5'-TTCAACACCACCTCCAGTC-3' 5'-CAGCATAATAGTCCTCCCAC-3' MCT4 5'-AGCCCAGTGTTCCTTTGTG-3' 5'-ACAGCAGTTGAGCAGTAGG-3' -actin 5'-CTGGGTATGGAATCCTGTGG-3' 5'-GTACTTGCGCTCAGGAGGAG-3' Figure.S5 (a) A list of primers used in this study is provided.