Body Temperature Distributions in Statistical Analysis
Explore how body temperature data is analyzed through bootstrap and randomization distributions to test hypotheses, centering around the average human body temperature. See the generation of randomization samples and the comparison between bootstrap and randomization distributions.

Download Presentation

Please find below an Image/Link to download the presentation.
The content on the website is provided AS IS for your information and personal use only. It may not be sold, licensed, or shared on other websites without obtaining consent from the author. If you encounter any issues during the download, it is possible that the publisher has removed the file from their server.
You are allowed to download the files provided on this website for personal or commercial use, subject to the condition that they are used lawfully. All files are the property of their respective owners.
The content on the website is provided AS IS for your information and personal use only. It may not be sold, licensed, or shared on other websites without obtaining consent from the author.
E N D
Presentation Transcript
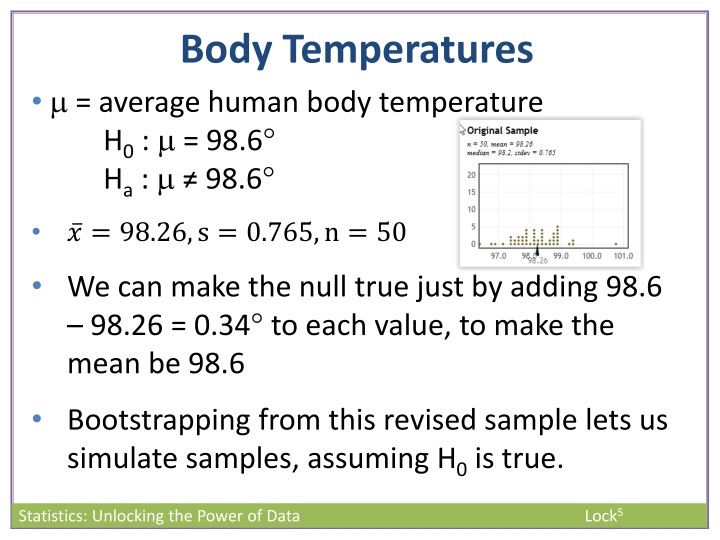
Body Temperatures = average human body temperature H0 : = 98.6 Ha : 98.6 ? = 98.26,s = 0.765,n = 50 We can make the null true just by adding 98.6 98.26 = 0.34 to each value, to make the mean be 98.6 Bootstrapping from this revised sample lets us simulate samples, assuming H0 is true. Lock5 Statistics: Unlocking the Power of Data
Body Temperatures In StatKey, when we enter the null hypothesis the shifting is automatically done for us. StatKey p-value = 0.002 Lock5 Statistics: Unlocking the Power of Data
Generating Randomization Samples The specific method varies with the situation, but the general idea is always the same: simulate samples assuming the null is true As long as the original data is used and the null hypothesis is true, most methods usually give similar answers in terms of a p-value Technology generates the randomizations for you, so most important is not understanding how to generate randomization samples, but why (what statistics would we see if H0 were true?) Lock5 Statistics: Unlocking the Power of Data
Body Temperature We created a bootstrap distribution for average body temperature by resampling with replacement from the original sample ( ? = 98.26): Lock5 Statistics: Unlocking the Power of Data
Body Temperature We also created a randomization distribution to see if average body temperature differs from 98.6 F by adding 0.34 to every value to make the null true, and then resampling with replacement from this modified sample: Lock5 Statistics: Unlocking the Power of Data
Body Temperature These two distributions are identical (up to random variation from simulation to simulation) except for the center The bootstrap distribution is centered around the sample statistic, 98.26, while the randomization distribution is centered around the null hypothesized value, 98.6 The randomization distribution is equivalent to the bootstrap distribution, but shifted over Lock5 Statistics: Unlocking the Power of Data
Bootstrap and Randomization Distributions Bootstrap Distribution Randomization Distribution Our best guess at the distribution of sample statistics Our best guess at the distribution of sample statistics, if H0 were true Centered around the null hypothesized value Centered around the observed sample statistic Simulate sampling from the population by resampling from the original sample Simulate samples assuming H0 were true Big difference: a randomization distribution assumes H0 is true, while a bootstrap distribution does not Lock5 Statistics: Unlocking the Power of Data
Body Temperature Bootstrap Distribution When the null value is in the tails of the bootstrap distribution (not in the CI), the sample statistic is in the tails of the randomization distribution (reject H0) 98.6 98.26 Randomization Distribution H0: = 98.6 Ha: 98.6 Lock5 Statistics: Unlocking the Power of Data
Body Temperature Bootstrap Distribution When the null value is not in the tails of the bootstrap distribution (in the CI), the sample statistic is not in the tails of the randomization distribution (do not reject H0) 98.4 98.26 Randomization Distribution H0: = 98.4 Ha: 98.4 Lock5 Statistics: Unlocking the Power of Data
Intervals and Tests A confidence interval represents the range of plausible values for the population parameter If the null hypothesized value IS NOT within the CI, it is not a plausible value and should be rejected If the null hypothesized value IS within the CI, it is a plausible value and should not be rejected Lock5 Statistics: Unlocking the Power of Data
Intervals and Tests If a 95% CI contains the parameter in H0, then a two-tailed test should not reject H0 at a 5% significance level. If a 95% CI misses the parameter in H0, then a two-tailed test should reject H0 at a 5% significance level. Lock5 Statistics: Unlocking the Power of Data
Body Temperatures Using bootstrapping, we found a 95% confidence interval for the mean body temperature to be (98.05 , 98.47 ) This does not contain 98.6 , so at = 0.05 we would reject H0 for the hypotheses H0 : = 98.6 Ha : 98.6 Lock5 Statistics: Unlocking the Power of Data


