Bootstrap Confidence Intervals for Reese's Pieces
This informative content explores the concept of sampling distribution in statistics, specifically focusing on calculating the proportion of orange Reese's Pieces using bootstrapping methods. It emphasizes the importance of standard error and confidence intervals, providing a visual representation to aid understanding.

Download Presentation

Please find below an Image/Link to download the presentation.
The content on the website is provided AS IS for your information and personal use only. It may not be sold, licensed, or shared on other websites without obtaining consent from the author.If you encounter any issues during the download, it is possible that the publisher has removed the file from their server.
You are allowed to download the files provided on this website for personal or commercial use, subject to the condition that they are used lawfully. All files are the property of their respective owners.
The content on the website is provided AS IS for your information and personal use only. It may not be sold, licensed, or shared on other websites without obtaining consent from the author.
E N D
Presentation Transcript
BOOTSTRAP CONFIDENCE INTERVALS PSU 016 11/9/14
REESES PIECES REESE S PIECES What proportion of Reese s pieces are orange?
IMPORTANT POINTS IMPORTANT POINTS Sample statistics vary from sample to sample. (they will not match the parameter exactly) KEY QUESTION: For a given sample statistic, what are plausible values for the population parameter? How much uncertainty surrounds the sample statistic? KEY ANSWER: It depends on how much the statistic varies from sample to sample!
REESES PIECES REESE S PIECES What proportion of Reese s pieces are orange? Take a random sample of 10 Reese s pieces Calculate the proportion of Orange in your sample. Come to the board to make a class dotplot You just made a sampling distribution!
SAMPLING DISTRIBUTION A sampling distribution is the distribution of sample statistics computed for different samples of the same size from the same population. A sampling distribution shows us how the sample statistic varies from sample to sample
Lots of simulations! Lots of simulations! We need many more simulations! www.lock5stat.com/statkey
REESES PIECES REESE S PIECES
STANDARD ERROR The variability of the sample statistic (how much it varies from sample to sample) is so important it gets it s own name The standard error of a statistic, SE, is the standard deviation of the sample statistic
REESES PIECES REESE S PIECES STANDARD ERROR ?(1 ?) ? 0.45(1 0.45) 10 = =0.157
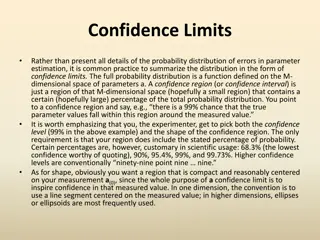
95% CONFIDENCE INTERVAL If the sampling distribution is relatively symmetric and bell-shaped, a 95% confidence interval can be estimated using statistic 2 SE
REESES PIECES Use our estimated SE (0.157) and your ? to create a 95% confidence interval based on your data. statistic 2 SE Did your 95% interval include the true p = 0.45? What proportion of intervals will contain the true p?
Confidence Intervals Confidence Intervals statistic 2 SE Sample Population Sample Sample . . . Sample Sample Sample Sampling Distribution Calculate statistic for each sample Standard Error (SE): standard deviation of sampling distribution
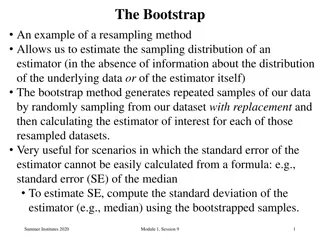
Reality Reality Check Check To create a plausible range of values for a parameter: o Take many random samples from the population, and compute the sample statistic for each sample o Compute the standard error as the standard deviation of all these statistics o Use statistic 2 SE One small problem
Reality Reality WE ONLY HAVE ONE SAMPLE!!!! How do we know how much sample statistics vary, if we only have one sample?!? BOOTSTRAP!
Population Population Imagine the population is many, many copies of the original sample (What do you have to assume?)
Suppose we have a random sample of 6 people:
Original Sample A simulated population to sample from
Sampling with Replacement Sampling with Replacement To simulate a sampling distribution, we can just take repeated random samples from this population made up of many copies of the sample In practice, we can t actually make infinite copies of the sample but we can do this by sampling with replacement from the sample we have (each unit can be selected more than once)
Bootstrap Sample: Sample with replacement from the original sample, using the same sample size. Original Sample Bootstrap Sample
Reeses Pieces Reese s Pieces Take a bootstrap sample from your sample of Reese s Pieces Sample 10 candies with replacement, and mark whether each one is Orange (Y/N).
BOOTSTRAP A bootstrap sample is a random sample taken with replacement from the original sample, of the same size as the original sample A bootstrap statistic is the statistic computed on a bootstrap sample A bootstrap distribution is the distribution of many bootstrap statistics
Bootstrap Sample Bootstrap Statistic Bootstrap Statistic Bootstrap Sample Original Sample Bootstrap Distribution . . . . . . Sample Statistic Bootstrap Sample Bootstrap Statistic
Lots of simulations! Lots of simulations! We need many more simulations! www.lock5stat.com/statkey
Bootstrap Bootstrap Distribution Distribution STANDARD ERROR Look familiar???
Why bootstrap? Why bootstrap ? Pull yourself up by your bootstraps Lift yourself in the air simply by pulling up on the laces of your boots Metaphor for accomplishing an impossible task without any outside help
SAMPLING DISTRIBUTION Population BUT, in practice we don t see the tree or all of the seeds we only have ONE seed
BOOTSTRAP DISTRIBUTION What can we do with just one seed? Grow a NEW tree! Bootstrap Population Estimate the distribution and variability (SE) of ? s from the bootstraps ?
Standard Error Standard Error The variability of the bootstrap statistics is similar to the variability of the sample statistics The standard error of a statistic can be estimated using the standard deviation of the bootstrap distribution!
Confidence Intervals Confidence Intervals statistic 2 SE Bootstrap Sample Sample Bootstrap Sample Bootstrap Sample . . . Bootstrap Sample Bootstrap Sample Bootstrap Distribution Calculate statistic for each bootstrap sample Standard Error (SE): standard deviation of bootstrap distribution
The Magic The Magic of Bootstrapping of Bootstrapping We can use bootstrapping to assess the uncertainty surrounding ANY sample statistic! If we have sample data, we can use bootstrapping to create a 95% confidence interval for any parameter! (well, almost )
USED MUSTANGS What s the average price of a used Mustang car? Select a random sample of n = 25 Mustangs from a website (autotrader.com) and record the price (in $1,000 s) for each car.
Sample of Mustangs: MustangPrice Dot Plot 0 5 10 15 20 25 30 35 40 45 Price ? = 25 ? = 15.98 ? = 11.11 Our best estimate for the average price of used Mustangs is $15,980, but how accurate is that estimate? BOOTSTRAP!
Original Sample 1. Bootstrap Sample 2. Calculate mean price of bootstrap sample 3. Repeat many times!
USED MUSTANGS Use StatKey (www.lock5stat.com/statkey) to generate your own 95% confidence interval for the price of used mustangs on autotrader.com.
USED MUSTANGS Standard Error
USED MUSTANGS 95% CI: ????????? 2 ?? $15,980 2 $2,178 ($11,624, $20,336) We are 95% confident that the average price of a used Mustang on autotrader.com is between $11,624 and $20,336
Other Levels of Confidence Best Guess at Sampling Distribution Best Guess at Sampling Distribution Best Guess at Sampling Distribution Best Guess at Sampling Distribution For a P% confidence interval: P% P% P% P% Lower Bound Observed Statistic Statistic Statistic Observed Observed Upper Bound Bound Upper 2 2 2 2 3 3 3 3 4 4 4 4 5 5 5 5 6 6 6 6 7 7 7 7 8 8 8 8 Statistic Statistic Statistic Statistic
Bootstrap CI Option 1: Estimate the standard error of the statistic by computing the standard deviation of the bootstrap distribution, and then generate a 95% confidence interval by statisti c 2 S E Option 2: Generate a P% confidence interval as the range for the middle P% of bootstrap statistics
Bootstrap Cautions Bootstrap Cautions These methods for creating a confidence interval work whenever the bootstrap distribution is smooth and symmetric ALWAYS look at a plot of the bootstrap distribution! If the bootstrap distribution is skewed or looks spiky with gaps, you will need something more advanced
SUMMARY SUMMARY The standard error of a statistic is the standard deviation of the sample statistic, which can be estimated from a bootstrap distribution Confidence intervals can be created using the standard error or the percentiles of a bootstrap distribution Confidence intervals can be created this way for any parameter, as long as the bootstrap distribution is approximately symmetric and continuous
HOMEWORK Bootstrap Confidence Interval Assignment on Canvas (due on Canvas before next class) Keep up with Piazza Posts Post pictures for the Get Involved assignment Participate in World-in-Conversation