Bootstrap Sampling Distribution Example and Estimating Techniques
Learn about bootstrap sampling distribution, a statistical method used for estimating standard errors and confidence intervals. Explore a simple example involving population sampling and see how to calculate mean and variance. Discover the importance of drawing random samples and inferring from the bootstrap sampling distribution.

Download Presentation

Please find below an Image/Link to download the presentation.
The content on the website is provided AS IS for your information and personal use only. It may not be sold, licensed, or shared on other websites without obtaining consent from the author. If you encounter any issues during the download, it is possible that the publisher has removed the file from their server.
You are allowed to download the files provided on this website for personal or commercial use, subject to the condition that they are used lawfully. All files are the property of their respective owners.
The content on the website is provided AS IS for your information and personal use only. It may not be sold, licensed, or shared on other websites without obtaining consent from the author.
E N D
Presentation Transcript
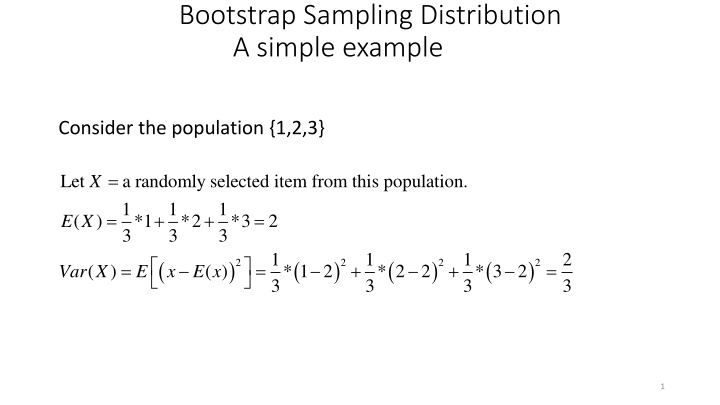
Bootstrap Sampling Distribution A simple example Consider the population {1,2,3} = Let a randomly selected item from this population. 1 1 1 *1 *2 *3 2 3 3 3 1 ( ) * 1 2 3 X = + + = ( ) E X 1 3 1 3 2 3 ( ) ( ) ( ) ( ) 2 2 2 2 = = + + = ( ) * 2 2 * 3 2 Var X E x E x 1
+ + x x x = Let be the mean of 3 randomly selected items (with replacement) 1 2 3 X 3 from this population. 1 ( ) * ( 3 1 ( ) 3 1 3 1 3 = + + = ) * ( E X ) * ( E X ) 2 E X E X 1 2 3 2 9 ( ) ( ) ( ) ( ) = + + = * var var var Var X X X X 1 2 3 2
The complete sampling distribution for the mean of three items selected randomly with replacement. %clearall clearall data data replacement; do x1=1 1 to 3 3; do x2=1 1 to 3 3; do x3=1 1 to 3 3; mn=mean(x1,x2,x3); output; end; end; end; run run; proc proc sql sql; select * from replacement; quit quit; proc proc means means data=replacement n mean var vardef=n; var mn; run run; 3
, , , ~ x x x F Consider drawing a random sample: 1 2 n We don t know , but we can estimate it by F the empirical probability distribution function F 1 n puts probability mass F on each i x A bootstr , x x ap sample is: * 1 * 2 * n * i , , , Where the are selected randomly wi , , n x th replac ement x x from x x 1 2 We base inferences on the bootstrap sampling distribution. 4
In the simple example we examined previously, we could enumerate the entire bootstrap sampling distribution. However as the sample size increases this becomes difficult (rapidly impossible). If there are observations The bootstrap sampling sampling distribution has possible samples (all equally likely) n n n 5
A major use of the Bootstrap is estimating standard errors and obtaining confidence intervals. We have a sample We want to estimate the s.e. of and a C.I. for some statistic , , , x x x 1 2 n S * 1 * 2 * n Select B bootstrap samples , ,..., from , , , x x x x x x 1 2 n = For each bootstrap sample calculate the statistic of The estimated standard error of is the standard deviation of the A 95% C.I. is the .025 and .975 percentiles of the interest: , 1,..., S i B i S S i S i 7
For many statistics we dont have a good analytic approximation 2 -- Approximate the sampling distribution of using bootstrap sampling. R 2 R 8
Drawing bootstrap samples is easy with PROC SURVEY select. data data tmp; do x=1 1 to 5 5; output; end; run run; %let reps=2; %let seed=39573293; proc proc surveyselect surveyselect data=tmp reps=&reps samprate=1 1 method=urs out=outboot seed=&seed; run run; proc proc print print data=outboot; run run; 10
The outhits option data data tmp; do x=1 1 to 5 5; output; end; run run; %let reps=2; %let seed=39573293; proc proc surveyselect surveyselect data=tmp outhits reps=&reps samprate=1 1 method=urs out=outboot(drop=NumberHits) seed=&seed; run run; proc proc print print data=outboot; run run; 11
A macro %macro %macro bootsamp(indat=,outdat=outboot,reps=5 5,seed=3759543 proc surveyselect data=&indat outhits reps=&reps samprate=1 1 method=urs out=&outdat (drop=numberhits) seed=&seed; run; %mend %mend bootsamp; 3759543); 13
Draw 1000 Bootstrap Samples data data tmp; set a.chd2018_a(keep=chol); run run; %bootsamp bootsamp(indat=tmp, reps=1000 seed=3759543 1000, 3759543) 15
Calculate the mean of each bootstrap sample. proc proc means means data=outboot nway noprint; class replicate; output out=outall mean=mnchol; run run; proc proc print print data=outall(obs=5 5); run run; 17
proc proc univariate univariate data=outall var mnchol; output out=pctls pctlpts=2.5 ; run run; proc proc print print data=pctls;run 2.5 97.5 97.5 pctlpre=pctl run; proc proc means means data=tmp clm stderr; var chol; run run; 18
Print bootstrap and normal assumption confidence limits. proc proc print print data=pctls; run run; proc proc means means data=tmp clm; var chol; run run; 19
The Process Select bootstrap samples Summarize each bootstrap sample separately Draw inferences based on the distribution of the summarizations 20


 & 95% C.I.")


