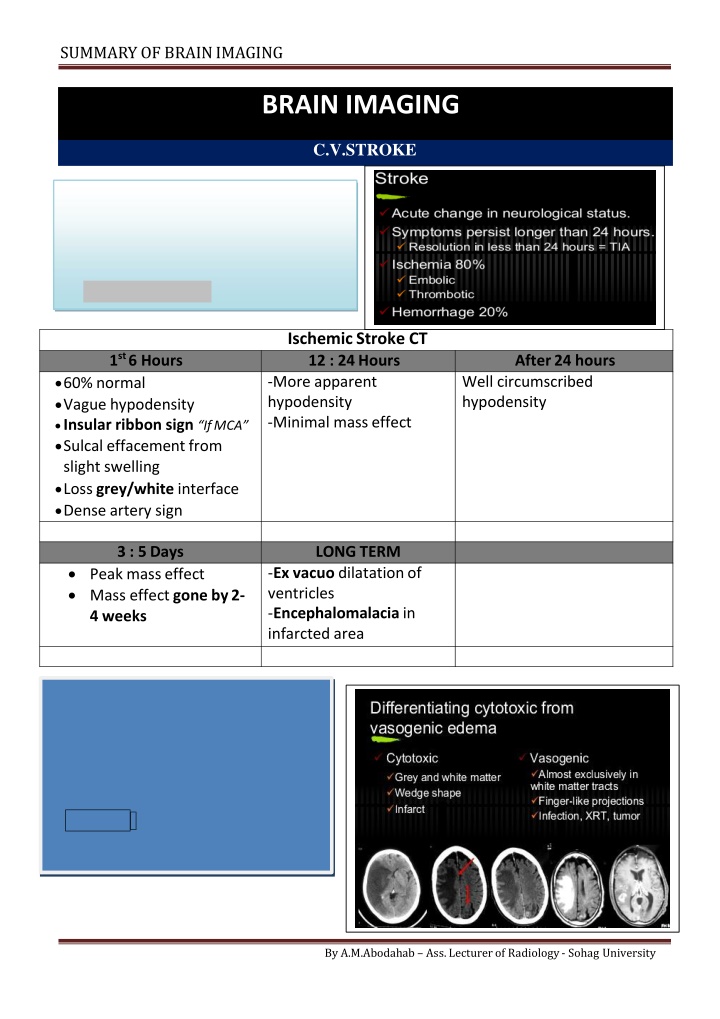
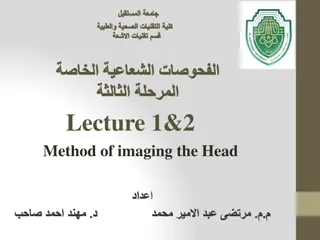
Brain imaging plays a crucial role in the diagnosis of strokes, with MRI being the fastest modality to detect infarction within minutes, while CT reveals more apparent hypodensity. This summary covers the differences in imaging findings at different time frames post-stroke, including acute, subacute, and chronic presentations. It also discusses intracranial hemorrhage locations and imaging characteristics of conditions like multiple sclerosis and brain tumors.
Please find below an Image/Link to download the presentation.
The content on the website is provided AS IS for your information and personal use only. It may not be sold, licensed, or shared on other websites without obtaining consent from the author. If you encounter any issues during the download, it is possible that the publisher has removed the file from their server.
You are allowed to download the files provided on this website for personal or commercial use, subject to the condition that they are used lawfully. All files are the property of their respective owners.
The content on the website is provided AS IS for your information and personal use only. It may not be sold, licensed, or shared on other websites without obtaining consent from the author.
E N D
Presentation Transcript
SUMMARY OF BRAINIMAGING BRAIN IMAGING C.V.STROKE MR Diffusion The Fastest Modality to detect Infarction within 2 minutes Restricted Diffusion Ischemic Stroke CT 12 : 24Hours -More apparent hypodensity -Minimal masseffect 1st 6 Hours After 24 hours 60% normal Vague hypodensity Insular ribbon sign IfMCA Sulcal effacement from slight swelling Loss grey/white interface Dense artery sign Well circumscribed hypodensity 3 : 5Days LONGTERM Peak masseffect Mass effect gone by2- 4 weeks -Ex vacuo dilatationof ventricles -Encephalomalacia in infarcted area -Enhancement in infraction begins after about 3 days -Enhancement > 6-8 weeks after Suggests anotheretiology New role: Perfusion .Infusion scans of brain with rapid IV contrast By A.M.Abodahab Ass. Lecturer of Radiology - Sohag University
SUMMARY OF BRAINIMAGING INSULAR RIBON SIGN DENSE A. SIGN Basilar A. Thrombus CHRONIC INFARCTION ACUTE INFARCTION Ischemic StrokeMRI: Acute stroke appears as - - - - - Normal to low signal on T1WI High signal onT2WI High signal onFLAIR High signal on DWI FLAIR and DWI most sensitive Signal Of Blood In different MRI Sequences Subacute Infarct By A.M.Abodahab Ass. Lecturer of Radiology - Sohag University
SUMMARY OF BRAINIMAGING Intracranial hemorrhage - possible locations: Intra-parenchymal Subarachnoid - - Intra-ventricular Subdural / epidural - - )Hypertensive bleed - most common (80%) -Basal ganglia -Pons -Thalamus -Cerebellum )usually symmetric( Normal variant: calcification in the basal ganglia & Dentate Neucli in Cerebellum Intraparynchymal Subdural Hage Intraventricular Subdural With Hematocriteffect By A.M.Abodahab Ass. Lecturer of Radiology - Sohag University
SUMMARY OF BRAINIMAGING MULTIPLE SCLEROSIS Clinical Diagnosis Young Adult 20 : 40 y Plaques Near & perpendicular toVentricles High signal in PD & FLIR Enhancing Active lesions By A.M.Abodahab Ass. Lecturer of Radiology - Sohag University
SUMMARY OF BRAINIMAGING BRAIN TUMORS HOMOGENOUS EHNANCING LYMPHOMA Peri-ventricular MENINGIOMA Dural Based +/- Duraltail GIANT CELL ASTROCYTOMA With TuberousSclerosis Near 3rdVentricle HETEROGENOUS EHNANCING GLIOBLASTOMAMULTIFORM ANAPLASTICASTROCYTOMA MARGINALEHNANCING GLIOBLASTOMAMULTIFORM Of Non Uniform Thickness CYST with EHNANCING MURAL NODULE Pilocytic Astrocytoma UsuallyInfra-tentorial D.D. Hamangioblastoma "Less common" Pleomomorphic Xanso Astrocytoma Never in PostFossa Supra tentorial Superficialnodule Hamangioblastoma 10:20 with VHLsyndrome 2-6 % of all BrainPrimaries 5 : 15y 4F :3M 1:2 % ofPrimary Most common Post Fossa T. in ADULTS STRONGLY ENHANCINGNODULE ANYPATTERN METs Multiple Known Primary SignificantEdema By A.M.Abodahab Ass. Lecturer of Radiology - Sohag University
SUMMARY OF BRAINIMAGING Meningioma Lymphoma GCA GlioblastomaMultiform AnaplasticAstrocytoma METS PilocyticAstrocytoma PleomomorphicXanso Astrocytoma MultipleHemangioblastomas By A.M.Abodahab Ass. Lecturer of Radiology - Sohag University
SUMMARY OF BRAINIMAGING INTRA CRANIAL CYST INTRA-AXIAL Astrocytoma Hydatid Porencephalic EXTRA-AXIAL ARACHNOID EPIDERMOID DERMOID PINEAL Others Abscess Cystecercosis Meningioma Deposites Arachnoid "CSF No Enh." Epidermoid Lobulated +/- Ca T1 Low<CSF / T2Hi>CSF Dermoid Rare Fat +/-Ca Rupture Fat Fluidlevel Never iso in FLIR RESTRICTEDDIFFUSION PinealCyst ColloidCyst HydatidCyst Porencephalic Craniophryngeoma By A.M.Abodahab Ass. Lecturer of Radiology - Sohag University
SUMMARY OF BRAINIMAGING POSTERIOR FOSSA LESIONS BRAIN STEM CEREBELLAR Hage / Infarction Tumors / Cysts Calcification 4thVentricle Ependymoma Medulloblastoma Others CPA Acoustic Neuroma 90% Meningioma2-4% Dermoid1% Others Age Site CT MRI T1 iso :Hypo T2 Hyper 4thVent. Commonest +Hydroecph. Ependymoma Child : Adult 5 : 1 -9% of allGliomas -10% of ped.CranialT Commonest PostFossa T. in Children Ca Lobulated isodense Homo or HeteroEnh 25:30% Medullo blastoma Hetero Enh. Ca 15% Cystic65% CSF Seeding40% Hetero Enh. Lo : ISoT1 Hi T2 Ependymoma Medulloblastoma By A.M.Abodahab Ass. Lecturer of Radiology - Sohag University
SUMMARY OF BRAINIMAGING CPA LESIONs AcousticNeuroma - 5-10 % of BrainT. - 90% of CPAT. 1 : 2 35 : 60 y NF II Bilateral AcousticNeuroma Meningioma EpiDermoid 2 % of BrainMasses 1 % ofCPA Incidence 2-4 % ofCPA F > M Adults M : F Age Associated CPA / SUPRA & PARACELLAR CisternaMagna NEVER AS CSF IN PD &FLIR Extra-axial wideCPA Character Arise fromIAM Cystic Change in Large Iso to Hypo Homogenous No CT ISO Hypo CSFLike NO UNCOMMON ENHANCE Ca Homogenous + Ca *T1 Iso : Hypo *T2 Hyper *Enh. StrongHomo *T1 Hypo between parenchyma &CSF *T2 Hyper >CSF *Diffusion Restricted MRI D.D. BASILARANEURYSM By A.M.Abodahab Ass. Lecturer of Radiology - Sohag University
SUMMARY OF BRAINIMAGING INTRA CRANIAL INFECTION Toxoplasosis CMV ADEM Ependymitis= Ventriculitis Cerebritis Cysticircosis By A.M.Abodahab Ass. Lecturer of Radiology - Sohag University
SUMMARY OF BRAINIMAGING INTRA VENTRICULAR LESIONS COMMON Ependymoma SubEpendymoma Papilloma Choroid Plexus Meningioma Neurocytoma SGC Astrosytoma OTHERS CYSTS TUMORS Arachnoid Astrocytoma Medulloblastoma Mets Epidermoid > Dermoid Colloid SUBEPENDYMOMA: Choroid Plexus Papilloma: -Variant ofEpendymoma -3% of Ped. I.C.T - 85% < 5y -Benign -No CSF Seeding -CT : 25 Ca &hage -Males 60th - Hyperdense - Lobulated - Solid / Homogenous -StrongHetero - T1 Iso / T2Hyper - 60% NoEnh +/- Cyst , Ca , Hage - NoEdema CT Iso T1 iso / T2 Hyper - - - Why Choroid Plexus Papiloma Central Neurocytoma: Hydrocephalus Commonest I.V. T in - - - IncreaseCSF Mechanical Haemorhage YoungAdult IV Meningioma Multiple inNFII -80 % trigone of Lat.V - 15 % 3rdVent. - 0.5% 4thVent. I.V.Meningioma Choroid Plexus Papiloma Middle Age Smooth margin Homogenous enh Focal Hydrocephalus - - - - Children Nodular surface Hetero. Enh Diffuse Hydroceph By A.M.Abodahab Ass. Lecturer of Radiology - Sohag University
SUMMARY OF BRAINIMAGING CORTICAL FORMATION DISORDERS Focal Cortical Dysplasia Hemimegaencephaly Band Heterotopia Double Cotex Lissencphaly Agyria DNET .Notice skull inner Scalloping Focal Heterotopia Pachygyria Ganglioglioma Polymicrogyria SubeoendymalHeterotopia Schizencephaly Closed/Open By A.M.Abodahab Ass. Lecturer of Radiology - Sohag University
SUMMARY OF BRAINIMAGING Metabolites of MR SPECTROSCOPY Phys. Significance Locate / ppm Metabolite Absent in Increased in Diminish in Rare Tissue of no neurons (Mets/Meningioma) N-Acetyl Aspartate NAA -Marker on Neuron Health -seen only inneuronal tissue -Stable in many Dis. -Used as control -Energy Metabolism Neuronal Damage "Canavan's Dis." 2.02 Creatine Cr Trauma Hyperosmolar Hypoxia Tumors 3.03 3.94 Choline Cho - Marker of memb. Synthesis & number of cells Active Tumor Inflammations MS ChronicHypox. Necrotic Tumor Stroke Abscess In aggressive diseaseprocess 3.2 Lactate Lac Normally absent or very low Double peak -Product of anaerobic metabolism -Released in cell destruct -May due to contamination of scalp Lipids Normally absent 0.9:1.2 3.56 -only short TE -Astrocytes Marker Myoinositol ml Alzheimer Demylenation Low g Glioma GliomatosisC. Tumefactive MS Hepatic Enceph. Sever Hypoxia Hepatic encephalo- pathy 2.1:2.5 -only short TE -Close to each=Glx -Regulate neurotransmitter activities Glutamate & Glutamine Glu Gln OTHERS Succinate = 2.4 Acetate = 1.9 Amino Acids = 0.9 Pyogenic Abcs. Alanine Meningioma ABC .. When Cho > Cr & NAA = Disease After 2 y of age Spectrum as inAdult AGE VARIATION Neonates Gradual increase Neuronal Maturation High High Adult Diminished Elevated NAA Cho. mi Cr. Increased By A.M.Abodahab Ass. Lecturer of Radiology - Sohag University