Break-Even Analysis and Revenue Management
"Learn about break-even analysis, revenue incomes, costs, and the interplay between them. Explore fixed, variable, and semi-variable costs, total costs, sales, and revenue calculations. Discover the significance of break-even analysis in business planning and decision-making."
Download Presentation

Please find below an Image/Link to download the presentation.
The content on the website is provided AS IS for your information and personal use only. It may not be sold, licensed, or shared on other websites without obtaining consent from the author. If you encounter any issues during the download, it is possible that the publisher has removed the file from their server.
You are allowed to download the files provided on this website for personal or commercial use, subject to the condition that they are used lawfully. All files are the property of their respective owners.
The content on the website is provided AS IS for your information and personal use only. It may not be sold, licensed, or shared on other websites without obtaining consent from the author.
E N D
Presentation Transcript
E2 BREAK-EVEN ANALYSIS Recap C2: What are the revenue incomes of a firm? Recap C3: What are the revenue costs of a firm? What do you think is the relationship between incomes and costs? BREAK-EVEN ANALYSIS
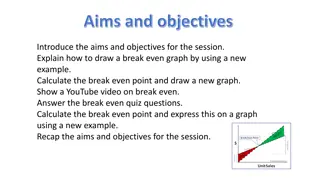
BREAK-EVENANALYSIS In this topic you will learn about Costs Variable Semi-variable Fixed Total Sales Total revenue Total sales Selling price per unit Sales in value and/or units Calculation using/manipulating, break-even formula (units and/or sales value), completion of break-even chart, break-even point Identification of area of profit, area of loss Identifying and calculating margin of safety (units and value) Calculation of total contribution, contribution per unit benefits and limitations Use of break-even for planning, monitoring, control and target setting Prepare, complete, analyse, revise and evaluate break-even
COSTS Fixed costs stay the same regardless of output e.g. rent and managers salaries Fixed costs are shown as a straight horizontal line when shown on a graph No of items Variable costs change in relation to the number of items produced e.g. raw materials Variable costs start at zero and slope upwards when shown on a graph No of items
COSTS Semi-variable costs are partly fixed and partly variable e.g. a production operative may get a basic salary that is fixed and then additional payments for the quantity produced Can you explain why a delivery van and a landline phone may be semi-variable?
TOTALCOSTS Total costs are fixed costs plus total variable costs TC = FC + TVC Total costs start at the fixed cost point on the y axis and slope upwards parallel to the variable cost line No of items Draw one diagram to show all 3 of the following lines: Fixed costs Variable costs Total costs
SALES Total revenue can also be referred to as: Turnover Sales Sales revenue Revenue Total revenue is the money coming in from the sale of goods and services Total revenue = selling price per unit x quantity If a business sold 20 000 units at a selling price of 15 Revenue = 15 x 20 000 units = 300 000 Total revenue increases with the amount of units sold and therefore starts at 0 and slopes upwards when shown on a graph No of items
SALES Total sales can be expressed in value or volume Value e.g. total sales were 150 000 in which case total revenue and total sales are the same Volume e.g. total sales were 100 000 units Assuming the 2 examples above relate to the same firm what was the selling price per unit?
BREAK-EVEN ANALYSIS Break-even is the point at which a business is not making a profit or a loss i.e. it is just breaking even At this point total costs must be the same as total revenue TR = TC Why might it take time for an airline to reach break-even? Break-even output is the number of items that a business must sell to reach this point Before reaching break-even a business is operating at a loss After reaching break-even each additional unit sold will contribute towards profit
TOTAL CONTRIBUTIONAND CONTRIBUTIONPERUNIT What does the word contribution mean? when we contribute we give towards something In business each time a good is sold or service provided what does the money generated contribute towards? it has to firstly pay for its own variable costs and then contribute towards the fixed costs until there are enough contributions to cover all the fixed costs the business can not start to make a profit Each time an item is sold the difference between the selling price and the variable cost is contributed towards the fixed cost The business has to keep putting this excess, the contribution, towards fixed costs until they are all paid off
TOTALCONTRIBUTIONAND CONTRIBUTION PERUNIT Contribution per unit is the difference between selling price per unit and variable cost per unit i.e. how much is left to contribute Firstly to fixed costs and secondly to profit Contribution = selling price variable cost If I sell t-shirts at 11.50 and each one costs me 4.00 to make then from each item sold I have a contribution of 7.50 (SP 11.50 VC 4.00) Total contribution is the difference between total sales revenue and total variable costs If I sell 100 t-shirts total sales revenue is (100 x 11.50) 1150 and total variable cost is (100 x 4.00) 400 Therefore total contribution is 1150 - 400 = 750 Give 3 examples of variables costs of the t-shirts.
CALCULATIONOF BREAK-EVEN OUTPUT Contribution per unit can be used to calculate break-even Give 3 examples of fixed costs of the t- shirts. Contribution = selling price variable costs Fixed cost / contribution = break-even point The fixed costs to manufacture the t-shirts is 15 000 Contribution = 11.50 - 4.00 = 7.50 Fixed cost / contribution = break-even point 15 000 / 7.50 = 2000 How much profit will the business make if it sells 2001 t-shirts? The business would have to sell 2000 t-shirts to break even
PRACTISEQUESTION Fixed costs = 60 000 Variable costs = 6.50 Selling price = 25.25 Sales 4000 units What is the contribution per unit? What is the total contribution? What is the break-even level of output?
CALCULATIONOF BREAK-EVEN OUTPUT Break-even is where neither a profit or a loss is being made (TC = TR) No of t-shirts 0 1 000 15 000 4 000 19 000 11 500 (7 500) 2 000 15 000 8 000 23 000 23 000 3 000 15 000 12 000 27 000 34 500 7 500 Fixed costs 15 000 Variable costs 0 Total costs 15 000 Total revenue 0 Loss/profit (15 000) 0
MARGINOFSAFETY Margin of safety is how much actual output is above the break-even level of output Calculated as: Actual output level break-even level of output T-shirts break-even = 2000 t-shirts Assume output = 3000 t-shirts Margin of safety = 1000 t-shirts Margin of safety can also be expressed as a value
BREAK-EVENCHARTS An alternative to calculating break-even via contribution is to plot the lines on a break-even chart This makes it easy to see where the break-even point is i.e. where total costs = total revenue Break-even point should be read off the horizontal axis and therefore expressed as a number of units e.g. 2000 t-shirts Why will it take so long for the night tube to break-even?
BREAK-EVEN CHARTSFILLINTHEGAPSAND DRAWEACHLINE Fixed costs stay the same and are therefore a _________________ line Variable costs change in relation to the number of items produced and therefore start at ________ and slope __________
BREAK-EVEN CHARTSFILLINTHEGAPSAND DRAWEACHLINE Total costs are ____________ = ______________ and therefore start at the point of ______________ and then slope ____________ at the same gradient as ________________ Total Revenue increases with the amount of units sold and therefore starts at ______ and slopes ________ You can put the cost and revenue lines together to find the break-even point. The important 2 lines being total costs (TC) and total revenue (TR).-
BREAK-EVEN CHARTS TR TC Costs and revenues VC FC 0 Units
BREAK-EVEN CHARTS TR TC Costs and revenues Break-even point FC 0 Units
BREAK-EVEN CHART T-SHIRTS Break Even Chart for T-shirts 40000 35000 30000 25000 Fixed Costs Variable Costs Total Costs Revenue 20000 15000 10000 5000 0 0 1000 2000 3000 No of units
USING BREAK-EVEN CHARTS Break-even charts can also be used to read off the loss or profit that would be experienced at different levels of sales TR TR3 TR3 >TC3 = Profit TC TC3 TC2 = TR2 = BEP TC1 TC1>TR1 = Loss TR1 costs/revenues Q1 Q2 Q3 Output
CHANGING VARIABLES Businesses should treat break-even with a degree of caution It is based on the assumption that costs and revenues will be static, in reality this is not true Businesses are advised to consider the variables that might change and possibly look at a number of scenarios Variables can change for the better or worse What variables might change? Fixed costs Landlord puts rent up Bank changes interest rates Management want pay increase Variable costs Raw materials change in price Minimum wage is increased Utility companies change price Selling price New competition enters the market Positive word of mouth puts demand up
ONTHESECONDGRAPHSHOWWHATWOULD HAPPENTOBREAK-EVENIFFIXEDCOSTSROSE BY 500 000s 000s TR TR 7 7 TC TC 6 6 5 5 4 4 3 3 2 2 1 1 0 1 2 3 4 5 0 1 2 3 4 5 Output(tonnes) Output (tonnes)
ONTHESECONDGRAPHSHOWWHATWOULD HAPPENTOBREAK-EVENIFVARIABLECOSTS FELLBY 200 PERTONNE 000s 000s TR TR 7 7 TC TC 6 6 5 5 4 4 3 3 2 2 1 1 0 1 2 3 4 5 0 1 2 3 4 5 Output(tonnes) Output (tonnes)
ONTHESECONDGRAPHSHOWWHATWOULD HAPPENTOBREAK-EVENIFSELLINGPRICE ROSEBY 50 PERTONNE 000s 000s TR TR 7 7 TC TC 6 6 5 5 4 4 3 2 2 1 1 0 1 2 3 4 5 0 1 2 3 4 5 Output(tonnes) Output (tonnes)
USEOFBREAK-EVEN In pairs annotate the diagram to show how break-even can be used for monitoring, planning, control and target setting. Planning Target setting Use Monitoring Control
STRENGTHSANDWEAKNESSESOF BREAK-EVEN Strengths Weaknesses Allows businesses to calculate the minimum number of sales needed before starting to make a profit and therefore for see if a venture is viable Is based on predicted costs and revenues Even fixed costs can vary in reality, especially in the long run Can calculate the level of profit or loss at different levels Ignores changes in variable costs or selling price as items are bought or sold in larger quantities Can predict the outcome of changing variables Only indicates the number of sales needed does not ensure actual sales will materialise Provides a target An integral part of a business plan when seeking to secure finance Aids decision making
BREAK-EVENANALYSIS In this topic you have learnt about Costs Variable Semi-variable Fixed Total Sales Total revenue Total sales Selling price per unit Sales in value and/or units Calculation using/manipulating, break-even formula (units and/or sales value), completion of break-even chart, break-even point Identification of area of profit, area of loss Identifying and calculating margin of safety (units and value) Calculation of total contribution, contribution per unit benefits and limitations Use of break-even for planning, monitoring, control and target setting Prepare, complete, analyse, revise and evaluate break-even


