Break-Even Analysis in Business
In business, understanding break-even points is crucial for profitability. Contribution per unit, total contribution, and calculating break-even are key concepts. This analysis helps determine the minimum price for selling products to cover costs and potentially make a profit.

Download Presentation

Please find below an Image/Link to download the presentation.
The content on the website is provided AS IS for your information and personal use only. It may not be sold, licensed, or shared on other websites without obtaining consent from the author.If you encounter any issues during the download, it is possible that the publisher has removed the file from their server.
You are allowed to download the files provided on this website for personal or commercial use, subject to the condition that they are used lawfully. All files are the property of their respective owners.
The content on the website is provided AS IS for your information and personal use only. It may not be sold, licensed, or shared on other websites without obtaining consent from the author.
E N D
Presentation Transcript
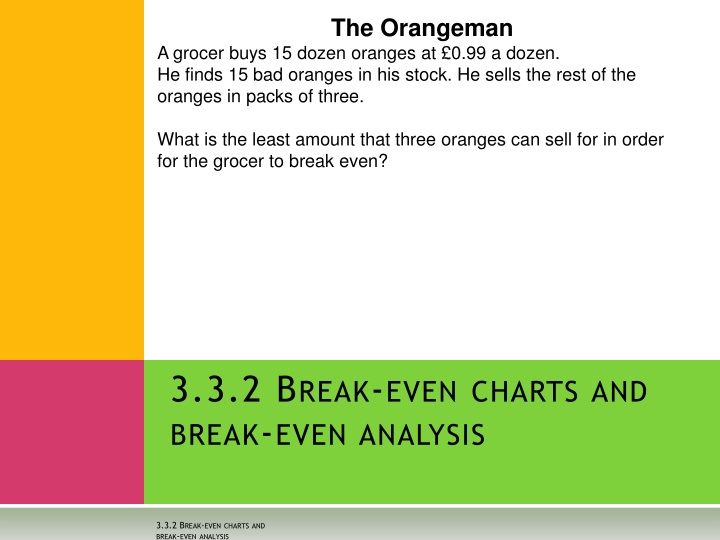
The Orangeman A grocer buys 15 dozen oranges at 0.99 a dozen. He finds 15 bad oranges in his stock. He sells the rest of the oranges in packs of three. What is the least amount that three oranges can sell for in order for the grocer to break even? 3.3.2 BREAK-EVENCHARTSAND BREAK-EVENANALYSIS 3.3.2 BREAK-EVENCHARTSAND BREAK-EVENANALYSIS
PROFITOR BREAK-EVEN? Making a profit will be the ultimate goal of most businesses but in the short term they may have to be satisfied with breaking even: _____________________________________ _____________________________________ _____________________________________ _____________________________________ Break-even can be explained using the concept of contribution
3.3.2 BREAK-EVENCHARTSAND BREAK-EVENANALYSIS CONTRIBUTIONAND CONTRIBUTIONPERUNIT What does the word contribution mean? when we contribute we___________________________________ In business each time a product is sold or service provided what does the money generated (the sales revenue) contribute towards? firstly pay for its own ____________________________ and then contribute towards the ___________________________________ Until there are enough contributions to cover all the ____________ _______________________________________________________
3.3.2 BREAK-EVENCHARTSAND BREAK-EVENANALYSIS CONTRIBUTIONAND CONTRIBUTIONPERUNIT Contribution per unit is therefore the difference between selling price per unit and variable cost per unit i.e. how much is left to contribute to: Firstly to fixed costs Secondly to profit Contribution = Selling Price Variable Cost If I sell T-shirts at 11.50, and each one costs me 4.00 to make, then from each item sold I have a contribution of ____________________________ Total Contribution is the difference between total sales revenue and total variable costs: If I sell 100 T-shirts total sales revenue is ____________________________ and total variable cost is __________________________________________ Therefore total contribution is ___________________________________
CALCULATIONOF BREAK EVEN OUTPUT Break even is the point at which a business is ____________________________________________ Therefore at this point _________________________ _____________________________________________ Each time an item is sold the difference between the selling price and the variable cost _________________ ______________________________________________ The business has to keep putting this excess (the contribution) towards ___________________________ ______________________________________________
CALCULATIONOF BREAK EVEN OUTPUT Contribution per unit can therefore be used to calculate break even Contribution = Selling Price Variable costs Fixed Cost / contribution = Break Even point 1. 2. The fixed costs to manufacture the T-shirts is 15000, selling price is 11.50 and variable costs per t-shirt is 4.00. The business would have to sell __________ T-shirts to break even Workings:
3.3.2 BREAK-EVENCHARTSAND BREAK-EVENANALYSIS CALCULATIONOF BREAK EVEN OUTPUT Remember break even is where neither a profit or a loss is being made (TC = TR) complete the table below and identify the number of teachers needed to be sold to breakeven. No of T-shirts 0 1000 2000 3000 Fixed Costs 15000 Variable Costs 0 Total Costs 15000 Total Revenue 0 Loss/Profit (15000)
QUESTIONTIME 2 MARKS A business manufactures rocking horses. The table shows their predicted figures for next year. Selling price per rocking horse 100 Variable cost per rocking horse 40 Fixed costs 12 000 How many rocking horses do they need to sell to breakeven? rocking horses
3.3.2 BREAK-EVENCHARTSAND BREAK-EVENANALYSIS BREAK EVENCHARTS An alternative to calculating break even via contribution is to plot the lines on a break even chart This makes it easy to see where the break even point is i.e. where Total Costs = Total Revenue Break Even point should be read off the horizontal axis and therefore expressed as a number of units e.g. 2000 T-shirts
3.3.2 BREAK-EVENCHARTSAND BREAK-EVENANALYSIS BREAK EVEN CHARTS THEBUILDUP Fixed costs No of items Variable costs No of items Total Costs No of items
3.3.2 BREAK-EVENCHARTSAND BREAK-EVENANALYSIS BREAK EVEN CHARTS THEBUILDUP Total Revenue No of items TR TC Break Even Point TC=TR We now have to put our cost and revenue lines together to find the break even point. The important 2 lines being total costs (TC) and total revenue (TR). No of items Break Even Output read off the horizontal axis
BREAK EVEN CHART 3.3.2 BREAK-EVENCHARTSAND BREAK-EVENANALYSIS T-SHIRTS Break Even Chart for T-shirts 1. What are the fixed costs at 2000 units? 2. What are the variable costs at 2000 units? 3. What are the total costs at 1000 units? 4. What is the total revenue at 3000 units? 5. What is the breakeven level of output? 40000 35000 30000 25000 Fixed Costs Variable Costs 20000 Total Costs Revenue 15000 10000 5000 0 0 1000 2000 3000 No of units
DRAWINGABREAKEVEN CHART A business manufactures computer desks. TASK: Draw a break even chart Step 1: Complete the table Step 2: plot the total cost and total revenue line on graph paper Step 3: label the breakeven point Fixed costs = 10 000 Variable cost per desk = 22 Selling price = 47 Desks 0 200 400 600 FC VC TC TR
FINANCIAL PLANNING BREAK EVEN Prior to trading an entrepreneur may draw a break even chart or calculate break even to help see if their _____________________________ i.e. how many units will they need to sell to break even This can then be compared to predicted sales estimated from ____________________________ If predicted sales is greater than break even point they may then consider by how much The difference between predicted sales, if higher than break even, and the break even point is known as the __________________________________
3.3.2 BREAK-EVENCHARTSAND BREAK-EVENANALYSIS USING BREAK EVEN CHARTS Break even charts can also be used to read off the loss or profit that would be experienced at different levels of sales TR TR3 TR3 >TC3 = Profit TC TC3 TC2 = TR2 = BEP TC1 TC1>TR1 = Loss TR1 No of items Q1 Q2 Q3
BREAKEVEN CHART Break Even Chart for T-shirts 40000 35000 30000 25000 Fixed Costs Variable Costs 20000 1. At 1500 units will the business make a profit or a loss? Total Costs Revenue 15000 10000 5000 2. At 2500 units will the business make a profit or a loss? 0 0 1000 2000 3000 No of units 3. If they sell 1000 units how much profit or loss is made? 4. If they sell 3000 units how much profit or loss is made?
USINGABREAKEVENCHART As well as identifying costs, revenues, break even and profit or loss a breakeven chart can also be used to: Identify the margin of safety the difference between _________________________ _____________________________________________ Formula:
BREAKEVEN CHARTS TR TC Costs and revenues FC 0 Units
3.3.2 BREAK-EVENCHARTSAND BREAK-EVENANALYSIS CHANGING VARIABLES PRICE, COSTSANDREVENUES Read through each point Established businesses as well as business start-ups must treat break even with a degree of caution What variables might change? Fixed Costs Landlord puts rent up It is based on the assumption that costs and revenues will be static Bank changes interest rates Management want pay increase Variable Costs In reality this is not true Raw materials change in price Businesses are often therefore advised to consider the variables that might change and possibly look at a number of scenarios Minimum wage is increased Utility companies change price Selling Price New competition therefore forced to lower price Remember variables can change for the better or worse Positive word of mouth puts demand up
WHICHISA STRENGTHSOR WEAKNESSESOF BREAK EVEN? Ignores changes in variable costs or selling price as items are bought or sold in larger quantities Is based on predicted costs and revenues Allows entrepreneurs to calculate the minimum number of sales needed before starting to make a profit Can foresee the level of profit or loss at different levels Can predict the outcome of changing variables Even fixed costs can vary in reality Provides a target A new entrepreneur may lack experience in predicting costs and hence draw a break even on inaccurate data Aids decision making Only indicates the number of sales needed does not ensure actual sales will materialise An integral part of a business plan when seeking to secure finance