Bright Future Technologies Financial Plan Overview" (Limiting to 80 characters)
"Strategic financial projections for Bright Future Technologies focusing on sustainable growth in residential solar energy. Detailed revenue, expense, profit, and cash flow projections over a 5-year period presented in a comprehensive business plan template." (Limiting to 500 characters)

Download Presentation

Please find below an Image/Link to download the presentation.
The content on the website is provided AS IS for your information and personal use only. It may not be sold, licensed, or shared on other websites without obtaining consent from the author.If you encounter any issues during the download, it is possible that the publisher has removed the file from their server.
You are allowed to download the files provided on this website for personal or commercial use, subject to the condition that they are used lawfully. All files are the property of their respective owners.
The content on the website is provided AS IS for your information and personal use only. It may not be sold, licensed, or shared on other websites without obtaining consent from the author.
E N D
Presentation Transcript
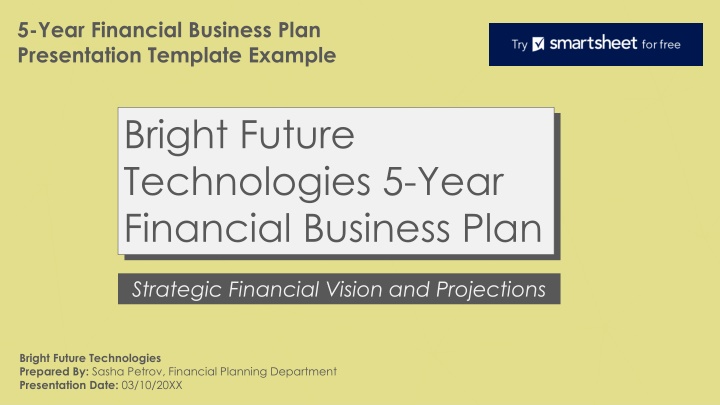
5-Year Financial Business Plan Presentation Template Example Bright Future Technologies 5-Year Financial Business Plan Strategic Financial Vision and Projections Bright Future Technologies Prepared By: Sasha Petrov, Financial Planning Department Presentation Date: 03/10/20XX
Contents 1. 2. 3. 4. 5. 6. 7. 8. 9. Executive Summary Revenue Projections Expense Projections Profit and Loss (P&L) Statement Cash Flow Projections Funding Plan Break-Even Analysis Key Performance Indicators (KPIs) Appendices
1. Executive Summary Plan Overview Bright Future Technologies' financial strategy focuses on achieving sustainable growth and market leadership in residential solar energy. Financial Snapshot Metric Year 1 Year 2 Year 3 Year 4 Year 5 Revenue ($) $800,000 $1,500,000 $3,000,000 $5,500,000 $10,000,000 Net Profit Margin (%) 12% 15% 18% 22% 25% Funding Needed ($) $500,000 $300,000 $200,000 N/A N/A
2. Revenue Projections Revenue Forecast Projected growth through product expansion and increased market penetration Revenue Drivers Smart solar panels, installation services, and SaaS-based energy analytics (Year 5 onwards) Product/Service Year 1 Year 2 Year 3 Year 4 Year 5 Smart Solar Panels $ 600,000.00 $ 1,000,000.00 $ 2,000,000.00 $ 3,500,000.00 $ 6,000,000.00 Installation Services $ 200,000.00 $ 500,000.00 $ 1,000,000.00 $ 1,500,000.00 $ 2,500,000.00 SaaS Subscriptions $ - $ - $ - $ - $ 1,500,000.00 Total Revenue $ 800,000.00 $ 1,500,000.00 $ 3,000,000.00 $ 5,000,000.00 $ 10,000,000.00
3. Expense Projections Operating Expenses (OPEX) Includes staffing, marketing, R&D, and administrative costs Costs of Goods Sold (COGS) Focus on efficient production and logistics Category Year 1 Year 2 Year 3 Year 4 Year 5 Staffing Costs $ 300,000.00 $ 400,000.00 $ 600,000.00 $ 800,000.00 $ 1,000,000.00 Marketing Expenses $ 100,000.00 $ 150,000.00 $ 200,000.00 $ 300,000.00 $ 400,000.00 R&D Costs $ 100,000.00 $ 200,000.00 $ 300,000.00 $ 400,000.00 $ 500,000.00 Administrative Costs $ 50,000.00 $ 70,000.00 $ 100,000.00 $ 150,000.00 $ 200,000.00 Total Revenue $ 550,000.00 $ 820,000.00 $ 1,200,000.00 $ 1,650,000.00 $ 2,100,000.00
4. Profit and Loss (P&L) Statement Overview Summarizes net profit progression over five years Year Revenue ($) COGS ($) Gross Profit ($) OPEX ($) Net Profit ($) Year 1 $ 800,000.00 $ 400,000.00 $ 400,000.00 $ 550,000.00 $ (150,000.00) Year 2 $ 1,500,000.00 $ 700,000.00 $ 800,000.00 $ 820,000.00 $ (20,000.00) Year 3 $ 3,000,000.00 $ 1,200,000.00 $ 1,800,000.00 $ 12,000,000.00 $ 600,000.00 Year 4 $ 5,500,000.00 $ 2,000,000.00 $ 3,500,000.00 $ 1,650,000.00 $ 1,850,000.00 Year 5 $ 10,000,000.00 $ 3,500,000.00 $ 6,500,000.00 $ 2,100,000.00 $ 4,400,000.00
5. Cash Flow Projections Cash Management Balances cash inflows and outflows for financial stability Year Opening Balance ($) Cash Inflows ($) Cash Outflows ($) Closing Balance ($) Year 1 $ - $ 800,000.00 $ 950,000.00 $ (150,000.00) Year 2 $ (150,000.00) $ 1,500,000.00 $ 1,520,000.00 $ (170,000.00) Year 3 $ (170,000.00) $ 3,000,000.00 $ 2,600,000.00 $ 230,000.00 Year 4 $ 230,000.00 $ 5,500,000.00 $ 4,300,000.00 $ 1,430,000.00 Year 5 $ 1,430,000.00 $ 10,000,000.00 $ 6,600,000.00 $ 4,830,000.00
6. Funding Plan Funding Requirements Outlines capital needs for Years 1 3 Use of Funds Year 1 Year 2 Year 3 Product Development $ 200,000.00 $ 100,000.00 $ 50,000.00 Marketing $ 150,000.00 $ 100,000.00 $ 50,000.00 Operational Setup $ 150,000.00 $ 100,000.00 $ 100,000.00 Total Funds Required $ 500,000.00 $ 300,000.00 $ 200,000.00
7. Break-Even Analysis Profitability Timeline Break-even point achieved in Year 3 Year Revenue ($) Fixed Costs ($) Variable Costs ($) Break-Even Revenue ($) Year 1 $ 800,000.00 $ 550,000.00 $ 4,000.00 $ 950,000.00 Year 2 $ 1,500,000.00 $ 820,000.00 $ 700,000.00 $ 1,520,000.00 Year 3 $ 3,000,000.00 $ 1,200,000.00 $ 1,200,000.00 $ 2,400,000.00
8. Key Performance Indicators (KPIs) Category KPI Year 1 Target Year 2 Target Year 3 Target Year 4 Target Year 5 Target Revenue Growth (%) 87.50% 87.50% 100.00% 83.30% 81.80% Gross Profit Margin (%) 50.00% 55.00% 60.00% 62.00% 65.00% Financial Net Profit Margin (%) 12.00% 15.00% 18.00% 22.00% 25.00% EBITDA Margin (%) 15.00% 17.00% 20.00% 25.00% 28.00% Revenue per Employee ($) $50,000.00 $75,000.00 $100,000.00 $125,000.00 $150,000.00 Customer Acquisition Cost (CAC) ($) $50.00 $45.00 $35.00 $30.00 $25.00 Operational Retention Rate (%) 70.00% 75.00% 80.00% 85.00% 90.00%
9. Appendices Document Type Description Purpose Financial Models Spreadsheets for revenue, expense, and cash flow forecasts Validate projections and funding needs Market Research Reports Insights into solar industry trends and customer behaviors Provide market context and strategy basis Break-Even Analysis Detailed cost breakdown and profitability timeline Show financial feasibility
DISCLAIMER Any articles, templates, or information provided by Smartsheet on the website are for reference only. While we strive to keep the information up to date and correct, we make no representations or warranties of any kind, express or implied, about the completeness, accuracy, reliability, suitability, or availability with respect to the website or the information, articles, templates, or related graphics contained on the website. Any reliance you place on such information is therefore strictly at your own risk.


 Statement")


")