The Bourse Régionale des Valeurs Mobilières (BRVM) is a fully integrated regional stock exchange serving 8 countries in West Africa. It ranks as the 6th largest African stock exchange by market capitalization, with 45 listed companies across various sectors. BRVM operates in a favorable macroeconomic environment within the West African Economic and Monetary Union (WAEMU) and is an executive member of the African Securities Exchanges Association (ASEA).
Please find below an Image/Link to download the presentation.
The content on the website is provided AS IS for your information and personal use only. It may not be sold, licensed, or shared on other websites without obtaining consent from the author. If you encounter any issues during the download, it is possible that the publisher has removed the file from their server.
You are allowed to download the files provided on this website for personal or commercial use, subject to the condition that they are used lawfully. All files are the property of their respective owners.
The content on the website is provided AS IS for your information and personal use only. It may not be sold, licensed, or shared on other websites without obtaining consent from the author.
E N D
Presentation Transcript
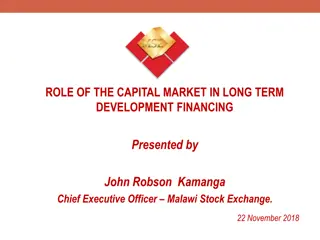
BRVM Dialogue with International Investors London, May 02nd2018 Dr. Edoh Kossi AMENOUNVE Chief Executive Officer of BRVM & DC/BR Chairman of West African Capital Markets Integration Council (WACMIC) Executive Committee African Securities Exchanges Association (ASEA)
| The BOURSE REGIONALE DES VALEURS MOBILIERES (BRVM) is a fully integrated and electronic regional stock exchange common to 8 countries in West Africa: Benin, Burkina Faso, Cote d Ivoire, Guinea-Bissau, Mali, Niger, Senegal and Togo. It is the 6thAfrican stock exchange in terms of market capitalization, and has 45 listed companies (May 2018) in the following sectors : transportation, industry, finance, public utilities, agriculture, distribution and others. BRVM is an executive member of the African Securities Exchanges Association (ASEA) and currently chairs the West African Capital Market Integration Council (WACMIC). 2
| A favorable macroeconomic environment WAEMU * 2015 2016 2017p 2018p Real GDP +6% +6.2% +6.5% +6.4% Nominal GDP (XOF bn.) 51,573 ($92.1 bn.) 55,874 ($99.8 bn.) 60,773 ($108.5 bn.) 66,023 ($117.9 bn.) Mali Population 2017 : 23.37 million Nominal GDP 2017 : XOF 7,491 bn. (USD 13.38 bn.) Real GDP 2017 : + 5.3% Inflation 2017 : 0.2% Total investment 2017 (% GDP): 35.9% FDI 2017 (% GDP): 0,89% Gross national savings 2017 (% GDP): 30.7% Inflation 1.5% 1.8% 1.9% 2% Total investment (% GDP) 22.8% 23.3% 23.3% 23.6% Senegal Population 2017 : 15.73 million Nominal GDP 2017 : XOF 9,528 bn. (USD 17.01 bn.) Real GDP 2017: + 6.8% Inflation 2017 : + 1.9% Total investment 2017 (% GDP): 27.4% FDI 2017 (% GDP): 3% Gross national savings 2017(% GDP): 20.5% FDI (% GDP) 2.7% 3.1% 3.4% 3.8% Gross national savings (% GDP) 15.5% 16.4% 16.5% 16.8% Niger Population 2017 : 21.5 million Nominal GDP 2017 : XOF 4,418.4 bn.(USD 7.9bn.) Real GDP 2017 : + 5.2% Inflation 2017 :+ 2.0% Total investment 2015 (% GDP): 42.1% FDI 2017 (% GDP): 5.8% Gross national savings 2017 (% GDP): 23.70% Mali Guinea Bissau Population 2017 : 1.83 million Nominal GDP 2017 : XOF 780.70 bn. (USD 1.39 bn.) Real GDP 2017 : + 5.9% Inflation 2017 : + 2% Total investment 2017 (% GDP): 11.1% FDI 2017 (% GDP): 1.7% Gross national savings 2017(% GDP): 7.8% Benin Population 2017: 11.1 million Nominal GDP 2017 : XOF 5,390 bn. (USD 9.3 bn.) Real GDP 2017 : + 5.4% Inflation 2017 : +2% Total investment 2017(% GDP): 28.6% FDI 2017 (% GDP): 4.6% Gross national savings 2017 (% GDP): 19.4% C te d Ivoire Population 2017 : 25 million Nominal GDP 2017 : XOF 22 505 bn.(USD40.2 bn.) Real GDP 2017 : + 8.1% Inflation 2017 : + 1.5% Total investment 2017 (% GDP): 19.9% FDI 2017 (% GDP): 3.3% Gross national savings 2017 (% GDP): 17.3% Togo Population 2017 : 7.35 million Nominal GDP 2017 : XOF 2,812 bn. (USD 5.02 bn.) Real GDP 2017 : + 5.3% Inflation 2017 : +1.5% Total investment 2017(% GDP): 26.1% FDI 2017 (% GDP): 5.2% Gross national savings 2017 (% GDP): 17.1% Burkina Faso Population 2017: 19.63 million Nominal GDP 2017 : XOF 7,587 bn. (USD13.1 bn.) Real GDP 2017 : + 6.4% Inflation 2017 : +1.5% Total investment 2017 (% GDP): 16.3% FDI 2017 (% GDP): 2.6% Gross national savings 2017 (% GDP): 9.2% Source: IMF , World Bank Group, BCEAO (Central Bank) * WAEMU : West African Economic and Monetary Union 3
| Stock Exchange with a unique profile Started operating in September 1998 Mali Niger Fully compliant with international standards electronic stock exchange, Listed company : 1 Brokerage firms : 1 Listed company: 1 Brokerage firms : 1 Common countries of the West African Economic and Monetary Union (WAEMU) : Benin, Burkina Faso, C te Bissau, Mali, Niger, Senegal and Togo stock exchange for the 8 Senegal Listed companies : 3 Brokerage firms : 4 Custodian : 3 d Ivoire, Guinea C te d Ivoire Only regional stock exchange in the world single unified, fully-integrated Listed companies : 35 Brokerage firms : 15 Custodians : 5 Successful technical capital market integration political, institutional and Burkina Faso Demutualized stock exchange Listed companies: 3 Brokerage firms : 2 Has a settlement guarantee fund to mitigate settlement risk Benin Togo Listed company : 1 Brokerage firms : 5 Listed company : 1 Brokerage firms : 1 45 Listed companies 37 Listed bonds 4
A favorable market to regional and foreign investors Single financial market regulator (CREPMF) IOSCO member No restriction on opening securities account in the 8 countries. A single regulatory framework modeled on international standards Investor protection provided Reporting of foreign currency used to invest in the stock market to facilitate outflows (*) Single commercial law for 8 countries (WAEMU region) No restriction on holdings of listed securities by foreign investors Electronic Stock Exchange (BRVM) Trading hours spanning international time zones for investors (9h 15 h GMT). Continuous trading. 11 Mandatory threshold crossing declarations (10%; 20%; 33.33%; 50% and 66.66%). % Free repatriation of income (dividends, interest, etc.) from securities investments (*). Integration of BRVM in MSCI and S & P indices Market information available on Bloomberg in real-time A banking network with 118 commercial banks including subsidiaries of large international banks such as Societe Generale, BNP PARIBAS, Standard Chartered, Citi, UBA, etc. Single Central Depository (DC/BR) ANNA and AMEDA member 97 % 8 custodian banks (subsidiaries of international banks) Use of a common currency, FCFA (XOF) pegged to the Euro at fixed parity. Use RTGS of BCEAO. Settlement at T+3 5 (*) Regulation N . 09/2010 / CM / UEMOA / on the External Financial Relations of the Member States of the West African Economic and Monetary Union (WAEMU) Settlement guarantee fund to ensure the effective completion of transactions
FOCUS | BRVMs IPO since 1998 FOCUS: BRVM IPOs since 1998 Market Cap as of first trading day(FCFA) 220 000 000 000 IPO year IPO Amount ( FCFA) Market Cap as of 31 December 31st 2017 Company Name IPO Date Variation 1998 SONATEL SIVOA (AIR LIQUIDE) NEI PALMCI SERVAIR BOA BENIN BOA NIGER ONATEL BF BOA C te d'Ivoire BOA Burkina F. Total S n gal BOA S n gal BOA MALI SIB CORIS SUCRIVOIRE 34 436 500 000 02/10/1998 2 350 000 000 000 968,18% 1999 1 109 400 000 19/04/1999 8 729 633 000 3 493 600 000 -59,98% -76,50% 165,71% 689,35% 1090,14% 2044,46% 99,58% 471,80% 686,68% 47,29% 55,04% 61,26% 12,96% 58,76% 1999 1999 1999 2000 2003 2009 2010 2010 2014 2014 2016 2016 2016 2016 435 500 000 6 240 000 000 822 528 000 1 680 000 000 346 005 000 30 600 000 000 2 760 000 000 2 300 000 000 3 480 000 000 5 850 000 000 8 790 000 000 26 146 000 000 36 750 000 000 14 651 000 000 14/04/2000 18/10/1999 31/03/2000 17/11/2000 30/12/2003 30/04/2009 07/04/2010 30/12/2010 20/02/2015 10/12/2014 31/05/2016 27/10/2016 23/12/2016 2 010 000 000 32 000 000 000 2 764 800 000 12 610 500 000 3 000 750 000 162 860 000 000 17 139 000 000 19 995 500 000 42 025 233 000 38 700 000 000 49 821 100 000 150 500 000 000 201 562 500 000 68 477 500 000 472 335 525 85 026 238 000 21 824 000 000 150 082 932 000 64 350 000 000 325 040 000 000 98 000 000 000 157 300 000 000 61 897 630 000 60 000 000 000 80 340 000 000 170 000 000 000 320 000 000 000 22 344 000 000 28/12/2016 -67,37% 2017 NSIA BANQUE 34 539 525 000 224 169 750 000 223 822 200 000 24/10/2017 -0,16% 2017 ECOBANK CI TOTAL 45 000 000 000 255 936 458 000 236 717 580 000 326 780 361 600 12/12/2017 38,05% 175,21 billions FCFA ($312.87 millions)raised via IPO in the WAMU region since 2014, with an average of 2 IPOs per year. 7
IPOs in 2017 2017 IPOs Market capitalization (FCFA) Company IPO Amount (FCFA) Listing date 34 539 525 000 224 169 750 000 NSIA BANQUE CI 24-oct-17 45 000 000 000 236 717 580 000 ECOBANK CI 12-d c-17 79 539 525 000 ($ 143.06 millions) 460 887 330 000 ($ 828.93 millions) NSIA BANQUE CI introduced to market from privatisation ECOBANK CI best share price performance in Africa in 2017. It's share price appreciated by 51% in USD terms as at 29th Dec. 2017 when compared to its IPO price (PWC) BRVM is the fourth Exchange in Africa in term of numbers of IPO in 2017 (PWC) With $143.06 millions raised in 2017, BRVM is the tenth Exchange in Africa in terms of amounts raised (PWC) BRVM expects 3 IPOs in 2018 1 Bank 2 SMEs 8
The New Vision for the next years To To make make BRVM an innovative BRVM an innovative Stock Exchange at the service of Stock Exchange at the service of the the Regional Regional Economy Economy
The five stratregic pillars Technological and operational strengthening by innovating tools Market literacy development Increase of liquidity and market depth Consolidation of shareholding, governance and demutualization Sustainability
Key actions identified and expected agenda Full membership of the World Federation Exchanges (WFE) ( 2018) Launch and deployment of the BRVM Elite Lounge (2018) Launch of Diaspora Bonds and Project Bonds (2018) Regional and International roadshows (2018 - 2020) Launch of the BRVM LabTech (2019) Securites Lending and Borrowing (2019) Launch of a new Board for commodities (2020) Integration of ECOWAS Stock Markets (2020) Listing of BRVM on BRVM (2022)
Launch of the process for becoming a Holding Digitalisation of business processess BRVM Key Figures by 2020 Net Income average increase of +16 % per year Average of 4 IPOs in the SME Board by 2019 5,4 billions FCFA (*) Investment in 3 years Average of 3 IPOs in the Main Board Launching of the process to list BRVM (*) $ 10,36 millions
Securities Lending and Borrowing Digital platform for UCITS DC/BR Key Figures by 2020 1,9 billions FCFA (*) investment in 3 years Launching of the DC/BR banking card for Corporate Actions Net Income average increase of +16 % per year 1,9 billions FCFA (*) Investment in 3 years (*) $ 3,64 millions
FOCUS | Integration of ECOWAS capital markets FOCUS: Integration of ECOWAS capital markets As of end of 2017 Nigerian Stock Exchange Equities market cap : 63.66 bn. USD Listed companies : 167 Brokerage firms : 248 WEST AFRICAN SECURITIES MARKET (WASM) Ghana Stock Exchange Equities market cap : 13.18 bn. USD Listed companies : 40 Brokerage firms : 21 Equities market cap: 89.03 bn. USD 7 % of the African securities market cap BRVM 256 listed companies Equities market cap : 12.21 bn. USD Listed companies : 45 Brokerage firms : 29 304 brokerage firms Cabo Verde* Second African stock exchange after Johannesburg SE Equities market cap : 753 m. USD Listed companies : 4 Brokerage firms : 5 Sierra Leone Stock Exchange Equities market cap : N/A Brokerage firms : 1 Brokerage firms : 1 15