Buffer ETF Intraperiod Performance - BMO US Equity Buffer Hedged to CAD ETF
This content showcases the intraperiod performance of BMO's US Equity Buffer Hedged to CAD ETF, focusing on various aspects such as profit/loss, upside cap, buffer zone, and range in price returns over different days leading up to the expiry. Visual representations are provided for days 1, 90, 180, 270, and at expiry.

Download Presentation

Please find below an Image/Link to download the presentation.
The content on the website is provided AS IS for your information and personal use only. It may not be sold, licensed, or shared on other websites without obtaining consent from the author.If you encounter any issues during the download, it is possible that the publisher has removed the file from their server.
You are allowed to download the files provided on this website for personal or commercial use, subject to the condition that they are used lawfully. All files are the property of their respective owners.
The content on the website is provided AS IS for your information and personal use only. It may not be sold, licensed, or shared on other websites without obtaining consent from the author.
E N D
Presentation Transcript
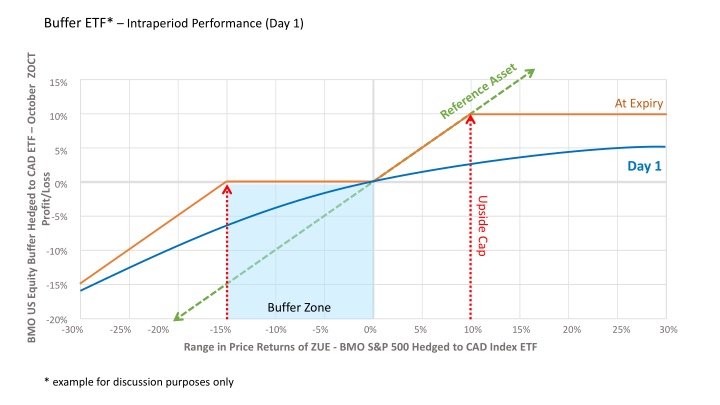
Buffer ETF* Intraperiod Performance (Day 1) BMO US Equity Buffer Hedged to CAD ETF October ZOCT 15% At Expiry 10% 5% Day 1 Profit/Loss 0% Upside Cap -5% -10% -15% Buffer Zone -20% -30% -25% -20% -15% -10% -5% 0% 5% 10% 15% 20% 25% 30% Range in Price Returns of ZUE - BMO S&P 500 Hedged to CAD Index ETF * example for discussion purposes only
Buffer ETF Intraperiod Performance (Day 90) BMO US Equity Buffer Hedged to CAD ETF October ZOCT 15% At Expiry 10% 5% Day 90 Profit/Loss 0% Upside Cap -5% -10% -15% Buffer Zone -20% -30% -25% -20% -15% -10% -5% 0% 5% 10% 15% 20% 25% 30% Range in Price Returns of ZUE - BMO S&P 500 Hedged to CAD Index ETF
Buffer ETF Intraperiod Performance (Day 180) BMO US Equity Buffer Hedged to CAD ETF October ZOCT 15% At Expiry 10% Day 180 5% Profit/Loss 0% Upside Cap -5% -10% -15% Buffer Zone -20% -30% -25% -20% -15% -10% -5% 0% 5% 10% 15% 20% 25% 30% Range in Price Returns of ZUE - BMO S&P 500 Hedged to CAD Index ETF
Buffer ETF Intraperiod Performance (Day 270) BMO US Equity Buffer Hedged to CAD ETF October ZOCT 15% At Expiry 10% Day 270 5% Profit/Loss 0% Upside Cap -5% -10% -15% Buffer Zone -20% -30% -25% -20% -15% -10% -5% 0% 5% 10% 15% 20% 25% 30% Range in Price Returns of ZUE - BMO S&P 500 Hedged to CAD Index ETF
Buffer ETF Intraperiod Performance (Expiry) BMO US Equity Buffer Hedged to CAD ETF October ZOCT 15% At Expiry 10% 5% Profit/Loss 0% Upside Cap -5% -10% -15% Buffer Zone -20% -30% -25% -20% -15% -10% -5% 0% 5% 10% 15% 20% 25% 30% Range in Price Returns of ZUE - BMO S&P 500 Hedged to CAD Index ETF
BMO US Equity Buffer Hedged to CAD ETF October ZOCT 15% At Expiry 10% 5% Profit/Loss 0% Upside Cap -5% -10% -15% Buffer Zone -20% -30% -25% -20% -15% -10% -5% 0% 5% 10% 15% 20% 25% 30% Range in Price Returns of ZUE - BMO S&P 500 Hedged to CAD Index ETF
")
")
")
")
")