Building a Vibrant Community for Optimal Health and Prosperity
Explore the key elements for fostering a vital and healthy community, including education, food security, prosperity, active living, and supportive health systems. Learn how these factors interconnect to promote physical, mental, and spiritual well-being. Contact us for more information on enhancing community health and equity.

Download Presentation

Please find below an Image/Link to download the presentation.
The content on the website is provided AS IS for your information and personal use only. It may not be sold, licensed, or shared on other websites without obtaining consent from the author. If you encounter any issues during the download, it is possible that the publisher has removed the file from their server.
You are allowed to download the files provided on this website for personal or commercial use, subject to the condition that they are used lawfully. All files are the property of their respective owners.
The content on the website is provided AS IS for your information and personal use only. It may not be sold, licensed, or shared on other websites without obtaining consent from the author.
E N D
Presentation Transcript
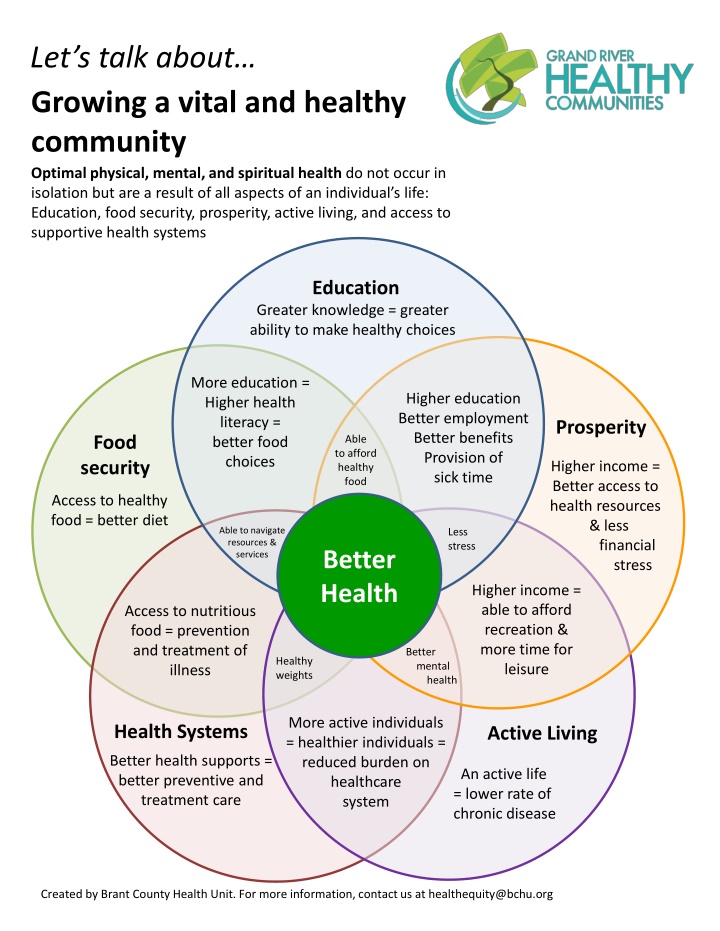
Lets talk about Growing a vital and healthy community Optimal physical, mental, and spiritual health do not occur in isolation but are a result of all aspects of an individual s life: Education, food security, prosperity, active living, and access to supportive health systems Education Greater knowledge = greater ability to make healthy choices More education = Higher health literacy = better food choices Higher education Better employment Better benefits Provision of sick time Prosperity Food security Able to afford healthy food Higher income = Better access to health resources & less financial stress Access to healthy food = better diet Able to navigate resources & services Less stress Better Health Higher income = able to afford recreation & more time for leisure Access to nutritious food = prevention and treatment of illness Better mental health Healthy weights More active individuals = healthier individuals = reduced burden on healthcare system Health Systems Active Living Better health supports = better preventive and treatment care An active life = lower rate of chronic disease Created by Brant County Health Unit. For more information, contact us at healthequity@bchu.org
Lets talk about Prosperity Intention: People and communities to prosper Key areas of focus: Income security, housing assistance, and having a safe place to live How are we doing? 63% feel it is safe to walk alone at night in their neighbourhood (KPS, 2012) Ontario: 71.8% 57% want to be more involved in making their community safer (Safe Brantford Report, 2016) 66% say addressing risk is key (Safe Brantford Report, 2016) 51% vs. 12% of 5-year old children are vulnerable in at least one area of development based on family income: below $17,000 vs. above $100,000 (EDI & KPS, 2012) 5thin Canada Brantford has the 5th highest auto theft rate in Canada (Macleans, 2010) $58,392 Average after-tax household income (NHS, 2011; Population 15+) Ontario: $71,523 $14.85 the living wage for Brantford, the hourly rate at which a household can meet its basic needs (BCHU, 2014) 13.4% of individuals 12+ are not satisfied with life (CCHS, 2013-14) Ontario: 9% 15.6% aware of local safety programs (Safe Brantford Report, 2016) Income has declined from 2007-2014 (CCHS, 2007-14) Safety needs -Youth service coordination -Mental health service coordination -Opportunities for residents to participate (Safe Brantford Report, 2016) 15% of the population has an after-tax income below the low income cut-off (NHS, 2011) Ontario: 13.9% $30,760 Average after-tax individual income (NHS, 2011; Population 15+) Ontario: $35, 249 Created by Brant County Health Unit (April 2017). For more information, contact us at healthequity@bchu.org
Lets talk aboutEducation Intention: Everyone has the skills and education to be successful in work, learning, and life Key areas of focus: High school graduation, integrated school curriculum, equitable education, optimize potential How are we doing? 15% of the population aged 25-64 does not have a high school diploma (NHS, 2011) are vulnerable in at least one area of development (EDI, 2015) Ontario: 29.4% 23% of parents are able to modify work hours to accommodate child care needs (KPS, 2012) Ontario: 19.3% 38% of 5-year old children 55% 39% of the population aged 25-64 has a post- secondary certificate, diploma, or degree (NHS, 2011) Ontario: 64.8% of parents report that childcare is too expensive (KPS, 2012) Ontario: 41.6% 29% of Brant elementary schools are ranked in the bottom 10% of Ontario schools (Fraser Institute, 2016-17) Ontario: 10% 13.4% of individuals 12+ are not satisfied with life (CCHS, 2013-14) Ontario: 9% 47% of the population of Ontario (16-65) have poor literacy skills (Level 2 or below) (PIAAC International Data Explorer, 2013) 53% of the population of Ontario (16-65) have poor numeracy skills (Level 2 or below) (PIAAC International Data Explorer, 2013) 61% of the population of Ontario (16-65) have poor computer skills (Level 2 or below) (PIAAC International Data Explorer, 2013) Created by Brant County Health Unit (Feb 2018). For more information, contact us at healthequity@bchu.org
Lets talk about Health Systems Intention: To improve existing resources and promote inclusive and accessible services that extend beyond the traditional healthcare system Key areas of focus: Service utilization, integrated support systems, Affordable transportation How are we doing? 32% of students in Grades 7-12 report moderate-to-high psychological distress (OSDUHS, 2015) Ontario: 34% 30% of individuals 12+ report smoking (CCHS, 2013-14) Ontario: 17.6% 15%* of students in Grades 7- 12 seriously considered suicide in the past 12 months) (OSDUHS, 2015) Ontario: 12.4% *use estimate with caution 18% of individuals 12+ consider their health to be poor or fair (CCHS, 2013-14) Ontario: 11.7% 13.4% of individuals 12+ are not satisfied with life (CCHS, 2013-14) Ontario: 9% 11% of individuals 12+ report having diabetes (CCHS, 2013-14) Ontario: 7% 93% of individuals 12+ have a regular family doctor (CCHS, 2013-14) 34% of individuals 12+ report having one or more chronic health conditions (CCHS, 2013-14) Ontario: 5.6% Created by Brant County Health Unit (April 2017). For more information, contact us at healthequity@bchu.org
Lets talk aboutActive Living Intention: Healthy, active people who attain their fullest mental, spiritual, and physical potential Key areas of focus: Recreation and leisure, after-school programs, arts and culture How are we doing? 54% would benefit from a policy to enhance access to recreational programs for all (Active Grand, 2016) 32% of those aged 65+ report daily active leisure activities (CCHS, 2013-14) 61% of individuals 12+ report a strong or somewhat strong sense of community belonging (CCHS, 2013-14) Child Development Irrespective of income, music, arts, or drama = better social, emotional, and cognitive development in 5 year old children (EDI & KPS, 2012) 13.4% of individuals 12+ are not satisfied with life (CCHS, 2013-14) Ontario: 9% 70% of students in Grades 7-12 use motorized transportation to get to school (car, bus, or taxi) (OSDUHS, 2015) Ontario: 73.4% 14% of Brant residents participated in a Parks and Recreation program during 2016 (Active Grand, 2016) 34% of children 12 and under meet physical activity guidelines (60 min, every day) (HKCC, 2016) 18-35 A gap in cultural programming exists for those aged 18-35 years (Brantford Cultural Audience Survey, 2015) 5 Top 5 cultural needs: Centralized online information high caliber music events professional live theatre children s programming mid-sized theatre (Brantford Cultural Audience Survey, 2015) 50% of those attending cultural events are 50+ years of age (Brantford Cultural Audience Survey, 2015) 45% of individuals are characterized as inactive during their leisure time (CCHS, 2013-14) Ontario: 46.3% 3 Top 3 barriers to cultural participation: Lack of time Don t know what s going on Timing of events (Brantford Cultural Audience Survey, 2015) 500m Residents who live within 500m of a trail walk, bike, run, and roller blade more than those living further (BCHU, 2015) Created by Brant County Health Unit (April 2017). For more information, contact us at healthequity@bchu.org
Lets talk about Food Security Intention: Access to healthy, affordable food for all within a sustainable food system Key areas of focus: Affordable food, quality nutrition, sustainable food systems How are we doing? 25,000 The number of farms lost in Ontario over the last 20 years (Ontario Food Nutrition Strategy report) 5% 2520 the average number of individuals who access the food bank every month (Brantford Food Bank, 2017) of Ontario s land is suitable for agriculture (OFA, 2013) 93% of elementary and secondary schools offer a school food program due to identified need (53/57 schools; BFFT, 2017) 184kg Of solid food is wasted by each Canadian, each year (Statistics Canada, 2008) 70% of the Canadian grocery market is dominated by four retail giants = exclusion of local producers (Barndt, 2008) $31billion cost of food wasted in Canada each year (Gooch et al., 2014) $204.19 The weekly cost to purchase nutritious food for a family of four (BCHU, 2015) 66% of individuals 12+ consume less than 5 fruits and vegetables per day (CCHS, 2013-14) Ontario: 61.2% 12%* of households report moderate to severe food insecurity (CCHS, 2013-14) *use estimate with caution 13.4% of individuals 12+ are not satisfied with life (CCHS, 2013-14) Ontario: 9% 51% of students in Grades 7-12 do not consume breakfast every day on school days (OSDUHS, 2015) Ontario: 47.7% 22% of students in Grades 7-12 report going to bed hungry due to insufficient food in the house (OSDUHS, 2015) Ontario: 23.5% Created by Brant County Health Unit (April 2017). For more information, contact us at healthequity@bchu.org