Explore the global efforts to combat corruption and enhance public integrity through initiatives funded by organizations like USAID and the EU. Gain insights from data on control of corruption evolution and governance outliers. Can public integrity be effectively built to tackle corruption worldwide?
Please find below an Image/Link to download the presentation.
The content on the website is provided AS IS for your information and personal use only. It may not be sold, licensed, or shared on other websites without obtaining consent from the author. If you encounter any issues during the download, it is possible that the publisher has removed the file from their server.
You are allowed to download the files provided on this website for personal or commercial use, subject to the condition that they are used lawfully. All files are the property of their respective owners.
The content on the website is provided AS IS for your information and personal use only. It may not be sold, licensed, or shared on other websites without obtaining consent from the author.
E N D
Presentation Transcript
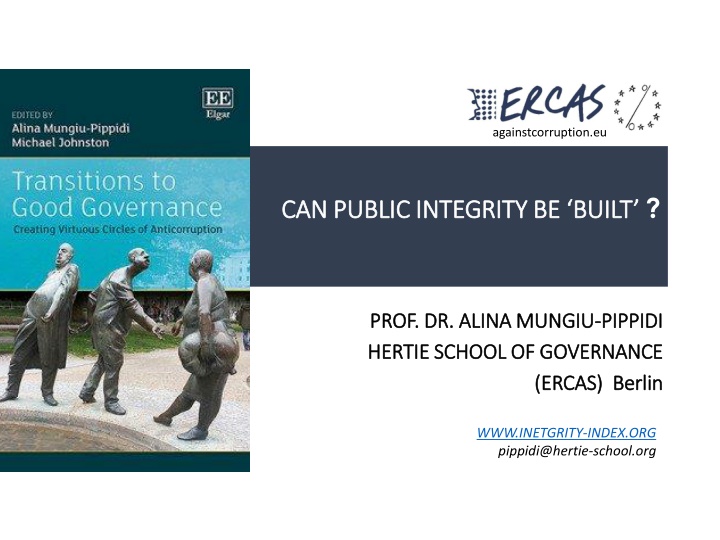
againstcorruption.eu CAN PUBLIC INTEGRITY BE BUILT CAN PUBLIC INTEGRITY BE BUILT ? PROF. DR. ALINA MUNGIU PROF. DR. ALINA MUNGIU- -PIPPIDI HERTIE SCHOOL OF GOVERNANCE HERTIE SCHOOL OF GOVERNANCE PIPPIDI (ERCAS) Berlin (ERCAS) Berlin WWW.INETGRITY-INDEX.ORG pippidi@hertie-school.org
Great Expectations Between 2007 and 2013, USAID sponsored projects worldwide that included anticorruption activities amounting to about US$ 6.7 billion, of which Iraq received one billion alone. In the same interval, the EU spent even more, with countries such as Turkey, Kosovo and Palestine receiving billions of euros to strengthen rule of law and control of corruption. Turkey received for rule of law alone nearly one billion euro over the last decade. Most democracies from the Third Wave are still systematically corrupt, and while least corrupt countries tend to be democracies, corrupt democracies are now twice as many as corrupt autocracies
But the world stays flat when public integrity is concerned Evolution of the WGI Control of Corruption Average Evolution of the WGI Control of Corruption Average by Income Group (1996 by Income Group (1996- -2015) 2015) High Income Low Income Lower Middle-Income Upper Middle-Income 10 9 8 WGI CONTROL OF CORRUPTION 7 (1 TO 10 BEST) 6 5 4 3 2 1 1996 1998 2000 2002 2003 2004 2005 2006 2007 2008 2009 2010 2011 2012 2013 2014 2015 Data source: World Governance Indicators & World Bank
Under the threshold of 6 (1-10), corruption becomes rampant, rule and not exception 34 35 29 30 25 23 20 Frequency 16 16 15 14 15 13 13 11 9 10 7 5 5 3 1 0 2.2 2.7 3.3 3.8 4.3 4.9 5.4 5.9 6.4 7.0 7.5 8.0 8.6 9.1 Higher Control of Corruption (Values from 1 to 10) Particularism Universalism n = 209
Can this be done? Structures versus agencies Can this be done? Structures versus agencies 2.5 Denmark New Zealand Netherlands Norway Singapore 2 Positive and negative governance outliers relative to human development Chile Qatar 1.5 Barbados Uruguay St. Lucia St. Kitts and Nevis 1 Botswana WGI Control of Corruption Bhutan Cape Verde (-2.5 to 2.5 best) 0.5 Rwanda Lesotho 0 Italy Greece Burkina Faso Mexico Mozambique Argentina -0.5 Liberia Palau Niger Ecuador Kazakhstan Russia Venezuela -1 Kyrgyz Republic Azerbaijan Tajikistan Uzbekistan Iraq Turkmenistan Equatorial Guinea -1.5 Myanmar -2 HDI Score (0 to 1 best) 0.2 0.3 0.4 0.5 0.6 0.7 0.8 0.9 1
Evolution of control of corruption (1-10) last 15 years averaged across rule of law and freedom categories. Minimal progress, and only where rule of law already exists 0.035 Still- 0.015 Brazil South Africa South Korea -0.005 non-RoL non-RoL RoL RoL not free not free partly free partly free free free -0.025 Even Spain! -0.045 -0.065 World Bank Control of Corruption and Freedom House sources of data -0.085 -0.105
Corruption as governance regime Author Continuum bad extreme Government restrictions Particularism (favoritism and corruption) Limited access order Continuum good extreme No government restrictions Ethical universalism Anne Krueger 1974 on rent seeking societies Mungiu-Pippidi 2006, 2015 on control of corruption (building on Weber, Parsons, Eisenstadt) North, Wallis and Weingast 2008 on social order and violence (Weber as well) Bo Rothstein and Jan Teorell 2008 on quality of government (some John Rawls also) Daron Acemoglu and James Robinson 2012 on prosperity Open access order Favoritism/ discrimination Impartiality Extractive institutions Inclusive institutions
Corruption as exceptional deviation Corruption as exceptional deviation (principal agent tools apply) (principal agent tools apply) versus corruption as main rule of the game versus corruption as main rule of the game (collective action problems) (collective action problems) Control of corruption is the capacity of a society to prevent ruling elites from channelling social allocation on the basis of particular interests, rather than market (price) or citizenship (equal treatment) Companies lose/win surprisingly when government changes Source: againstcorruption.eu (M. Fazekas) Hungary and UK
Main argument: two different contexts (regimes) in governance Features of ideal types of governance regimes Context A- Context B- corruption exception corruption norm not ethical universalism) informs the majority of government transactions with the result of widespread favoritism, discrimination Social practice where particularism (and public authority is abused to result undue private profit Individual behavior where Definition? flawed process, as well as through outcomes/consequences, so monitoring and curbing impunity needed Corruption observable as overt behavior, unobservable/whistleblowing needed Corruption Observable? allowed and transparent as lobby, and exchanges between the sides consequent in time (revolving doors) Selection and promotion independent from rulers, autonomy form private interest, corruption exceptional and individual rather the norm and conflict of interest ubiquitous (one person belongs to both sides in the same time) Completely dependent on rulers, selection particularistic (nepotism, politicization), corruption organized aspyramidal extraction Enshrined as norm, with access Permeable border, with patrimonialism Public private separation? Bureaucracy
Factor analysis Factor analysis- - one component explains one component explains 85% variation; 162,136 people in 119 85% variation; 162,136 people in 119 countries/ territories GCB countries/ territories GCB Kaiser-Meyer-Olkin Measure of Sampling Adequacy. ,811 Component Matrixa Communalities Component 1 Initial 1,000 1,000 Extraction Magistrates LocallyElected ,747 ,892 CentralGov LocallyElected ,947 ,944 Legisative Magistrates Extraction Method: Principal Component Analysis. ,936 ,864 CentralGov Legisative Extraction Method: Principal Component Analysis. 1,000 1,000 ,896 ,876 a. 1 components extracted. Source of data: Global Corruption Barometer 2017
Institutional (systematic) corruption AMP (Hertie School) - Systematic abuse of authority for diverting public resources/goods meant for universal use for the benefit of particular private interests Dennis Thompson (Harvard law)- perversion of democratic process for personal profit (centered on constitutional process) In fact, most influential corruption definitions these days refer to institutional corruption in my sense and not to the individual corruption (corruption as an exception) of developed societies due to post- Washington consensus institutional quality stress
Defined as such, corruption can be measured objectively Corruption in public construction market during crackdown in Romania (2007-2013) 2007-2013 change 2007 2008 2009 2010 2011 2012 2013 VALUE Single bidder Political connection2 Agency capture3 Total particularism 31% 23% 19% 24% 31% 12% 22% 20% 17% 26% 16% 21% 22% 20% 22% 13% 17% 9% 8% 14% 19% 52% 2007 30% 23% 9% 53% 2008 28% 21% 8% 44% 2009 20% 20% 8% 53% 2010 24% 19% 7% 49% 2011 24% 20% 8% 34% 2012 18% 18% 8% 39% 2013 12% 17% 6% N CONTRACTS Single bidder Political connection2 Agency capture3 Total particularism 48% 45% 41% 43% 44% 37% 33% Legend: Time series of particularism indicators in Romanian public procurement during intensive judicial anticorruption, 2007-2013, resulting in a decrease by a fifth of problematic transactions; indicates small change; indicates change over 10%; indicates no significant change. Source: Romanian Academic Society, www.sar.org.ro. [1] Single bidding. i.e. only one bid is submitted to a tender on a competitive market. [2] Political connection. Allocation to a company with political connections (politician shareholder, board member or party donor company, according to digital interest disclosures or donation reports) [3] Agency capture. Public agency awards 51% contracts or value of total contracts to one bidder.
A BALANCE HARD TO FIX A BALANCE HARD TO FIX A THEORY OF CHANGE OR RATHER OF STAGNATION? CHANGE OR RATHER OF STAGNATION? A THEORY OF Societies where we work do not have the societal conditions of Western first modern societiies We need to cut resources for corruption, as well as increase constraints We need to manipulate both sides of balance Source: Worldwide Governance Indicators; Freedom House. non-RoL/RoL: countries with WGI rule of law scores below/above the sample median; not/partly/ free corresponding freedom status by Freedom House.
Modernization of societies? Modernization of societies? Education matters, but especially education of 1900 would matter, but not in the short or medium term World Average 6 7 6 5 5 ICRG Control of Corruption 4 Years of Education 4 (0 to 6 Best) 3 3 2 2 1 1 0 0 1984 1985 1986 1987 1988 1989 1990 1991 1992 1993 1994 1995 1996 1997 1998 1999 2000 2001 2002 2003 2004 2005 2006 2007 2008 2009 ICRG COC Diff. Years of Education
The primacy of economics? The primacy of economics? Not really Not really GDP GDP per capita ICRG Corruption 20000 10 9 18000 8 16000 GDP percapita in 2010 US Dollars Corruption Score (1-10 Best) 7 14000 6 12000 5 10000 4 8000 3 6000 2 4000 1 1990 1991 1992 1993 1994 1995 1996 1997 1998 1999 2000 2001 2002 2003 2004 2005 2006 2007 2008 2009 2010 2011 2012 2013 2014 2015 n = +110 countries
Middle class? Maybe, but where is it? Middle class? Maybe, but where is it? World Average 6 100 90 5 80 ICRG Control of Corruption 70 4 (0 to 6 Best) GINI Index 60 3 50 40 2 30 20 1 10 0 0 ICRG Corruption GINI
Autonomy of bureaucracy or when the Autonomy of bureaucracy or when the Solution is the Problem Solution is the Problem Bureaucracy Bureaucracy Bureaucratic Quality ICRG Corruption 10 10 9 9 Bureaucratic Quality (1-10 Best) Corruption Score (1-10 Best) 8 8 7 7 6 6 5 5 4 4 3 3 2 2 1 1 1984 1986 1988 1990 1992 1994 1996 1998 2000 2002 2004 2006 2008 2010 2012 n = +120 (1986-1998), 140 (1999-2015) countries
Autonomy of the judiciary? 9 8 7 Judicial Independence Score (1-10) 6 5 4 2007 - 208 2017 - 2018 3 2 1 0 * 2008 - 2009 data used for earlier Countries
The cavalry? The cavalry? CAN EXOGENOUS FACTORS CAN EXOGENOUS FACTORS FILL THE GAP? FILL THE GAP? o P P O R T U NI TI E S C o n s t r a i n t s International norms and their enforcement International contribution to unaccountable money flows Jurisdictional vacuum (insufficient property rights, unclear boundaries) Norms- UNCAC Material resources (aid without good governance conditions, bribing across borders) Regulation FPCE, OECD, antimony laundering, etc
EU assisted countries (110) EU assisted countries (110) progress? progress? Comparison of the Control of Corruption mean (1 to 10 Best) 5.00 4.50 4.00 3.50 3.00 2002 Recipients of more aid 2003 2004 2005 2006 2007 2008 2009 2010 2011 2012 2013 2014 Recipients of less aidn=120
EU assisted countries (110) EU assisted countries (110) progress? progress? Comparison of the Judicial Independence mean (1 to 10 Best) 6.00 5.50 5.00 4.50 4.00 3.50 3.00 2006 2007 2008 2009 2010 2011 2012 2013 2014 Recipients of more aid Recipients of less aid n=+70
AID AND CONDITIONALITY Changes in governance indicators (2007-2014) of countries with most % EU anticorruption aid Cumulative Anti- corruption Aid (% Total Aid) Freedom of the Press Trading across Borders Control of Corruption Judicial Independence Starting Business Internet Users Country Montenegro Algeria 16.58 0.54 0.55 -0.09 0.40 1.30 2.72 13.64 -0.16 -0.29 0.09 0.98 0.11 0.78 Guinea-Bissau 9.08 -0.67 -0.54 0.23 5.06 0.10 Colombia Azerbaijan Nigeria Liberia Albania Cameroon 8.82 -0.36 -1.46 0.36 1.25 1.34 2.77 8.34 0.18 0.72 -0.90 1.52 2.41 4.18 6.57 -0.52 -0.68 0.00 1.44 0.22 3.23 5.10 -0.81 0.45 0.77 4.27 0.44 4.73 0.20 0.15 0.09 0.31 1.77 4.06 3.25 -0.36 0.95 -0.09 -0.28 2.85 0.73 Papua New Guinea 3.19 0.49 -0.09 0.04 0.02 0.68
Top ten performers Top ten performers on corruption control change on corruption control change TOP PERFORMERS (CHANGES FROM 2007 TOP PERFORMERS (CHANGES FROM 2007- -2014) AC Aid AC Aid USD USD million million NA NA Georgia Georgia 2014) AC Aid (in AC Aid (in USD USD millions) millions) NA NA Total Total Aid (% Aid (% GNI) GNI) 8.90 8.90 AC Aid (in AC Aid (in USD USD millions) millions) NA NA Control Control Corr. Corr. Total Aid (% Total Aid (% GNI) GNI) Free Free Press Press Total Aid Total Aid (% GNI) (% GNI) Country Country Country Country Judicial Ind. Judicial Ind. Country Country Georgia Georgia 1.78 1.78 8.90 8.90 1.98 1.98 Tunisia Tunisia Myanmar Myanmar (Burma) (Burma) Libya Libya 2.97 2.97 5.29 5.29 Rwanda Rwanda Maldives Maldives 1.48 1.48 1.30 1.30 13.65 13.65 1.29 1.29 0.32 0.32 NA NA Kenya Kenya Senegal Senegal FYRO FYRO Macedonia Macedonia 1.72 1.72 1.51 1.51 2.72 2.72 6.10 6.10 NA NA 0.22 0.22 2.16 2.16 1.89 1.89 0.30 0.30 0.37 0.37 NA NA NA NA Cote d'Ivoire Cote d'Ivoire Myanmar Myanmar (Burma) (Burma) Senegal Senegal Bhutan Bhutan Laos Laos PR Korea PR Korea Macedonia Macedonia 1.19 1.19 3.45 3.45 0.58 0.58 1.47 1.47 5.62 5.62 0.57 0.57 Zimbabwe Zimbabwe 1.71 1.71 7.93 7.93 0.76 0.76 1.17 1.17 1.03 1.03 0.95 0.95 0.94 0.94 0.85 0.85 0.79 0.79 0.30 0.30 6.10 6.10 2.27 2.27 1.97 1.97 NA NA 0.50 0.50 NA NA 0.22 0.22 NA NA NA NA 1.18 1.18 0.57 0.57 Chile Chile Indonesia Indonesia Bolivia Bolivia Uruguay Uruguay Zimbabwe Zimbabwe Nicaragua Nicaragua 1.45 1.45 1.34 1.34 1.29 1.29 1.17 1.17 1.03 1.03 1.01 1.01 0.09 0.09 0.12 0.12 2.30 2.30 0.19 0.19 7.93 7.93 4.07 4.07 NA NA 2.57 2.57 NA NA NA NA 0.76 0.76 NA NA Bangladesh Bangladesh Cote d'Ivoire Cote d'Ivoire Georgia Georgia Niger Niger Togo Togo Moldova Moldova 1.26 1.26 1.17 1.17 1.08 1.08 1.08 1.08 1.08 1.08 0.99 0.99 0.92 0.92 3.45 3.45 8.90 8.90 20.52 20.52 10.12 10.12 14.56 14.56 NA NA 0.58 0.58 NA NA NA NA NA NA 0.05 0.05
Seven lessons from success cases. 1. Virtuous circles of integrity exist, but they are no critical junctures but take long time to develop (Korean example) 2. All of them need enlightened elites, professional and political, or at least enlightened rulers (Botswana, Bhutan) 3. The empowerment of these elites is related to regime change, which needs to find them ready 4. The primacy of politics rules in most cases, and is not denied in any Governance Capacity- Development 5. Opportunities arise, but they need exceptional mobilization 6. Exogenous factor- matters, but not by external agencies (countries changed by donors), but by emulation and global waves of change 7. Domestic agency rules (all success cases changed by their own)
References to our evidence Crime, Law and Social Change Volume 68, Issue 4, November 2017 Special Issue, Evidence-based public integrity policies https://link.springer.com/journal/10611/68/4/page/1 Swedish Govt EBA paper Evidence Based Anticorruption. The Roadmap http://eba.se/en/seven-steps-to-evidence-based- anti-corruption-a-roadmap/#sthash.k02rtjXS.dpbs The second edition of the Index for Public Integrity is out for 109 countries at www.integrity-index.org Read its methodology here http://rdcu.be/uwfM


,")

 last 15")


")


")
")