Bus Route Performance Analysis 2018-2020
Explore the performance data of South Central Regional Transit District's bus routes from fiscal year 2018 to 2020. Analyze ridership numbers, service comparisons, and recommendations for optimizing route efficiency and attracting more passengers.
Uploaded on | 3 Views
Download Presentation

Please find below an Image/Link to download the presentation.
The content on the website is provided AS IS for your information and personal use only. It may not be sold, licensed, or shared on other websites without obtaining consent from the author. If you encounter any issues during the download, it is possible that the publisher has removed the file from their server.
You are allowed to download the files provided on this website for personal or commercial use, subject to the condition that they are used lawfully. All files are the property of their respective owners.
The content on the website is provided AS IS for your information and personal use only. It may not be sold, licensed, or shared on other websites without obtaining consent from the author.
E N D
Presentation Transcript
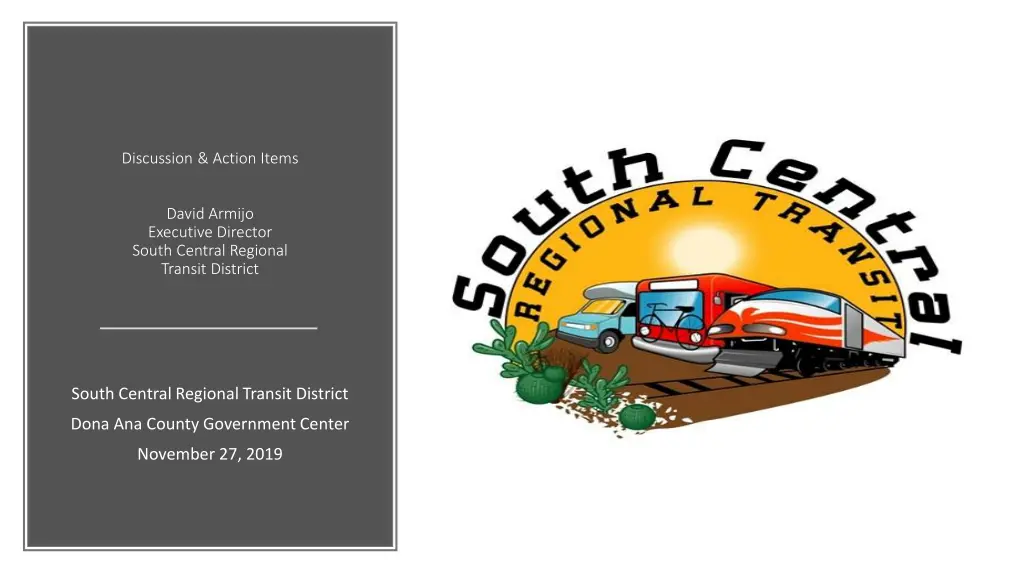
Discussion & Action Items David Armijo Executive Director South Central Regional Transit District South Central Regional Transit District Dona Ana County Government Center November 27, 2019
BUS ROUTE SERVICE PERFORMANCE BLUE ROUTE PERFORMANCE PUBLIC REVIEW BOARD OF DIRECTOR S HANDBOOK Summary FY2020 GOALS & OBJECTIVES SUNLAND PARK MOU CALL FOR PROJECTS EL PASO MPO
Bus Route Service Performance SCRTD RIDERSHIP - Fiscal Year 2018 - 19 System Period BLUE RED PURPLE TURQUOISE ORANGE YELLOW Added Service Passenger Total Jul-2018 314 693 648 292 310 80 2337 Aug-2018 318 1214 879 580 396 30 3417 Sep-2018 184 825 601 570 316 56 2552 Oct-2018 261 1163 796 584 321 0 3125 Nov-2018 245 1076 773 560 300 63 3017 Dec-2018 190 751 751 455 310 10 2467 Jan-2019 227 922 893 446 269 52 2809 Feb-2019 160 981 902 727 345 28 3143 Mar-2019 111 1002 933 692 300 20 3058 Apr-2019 229 1128 986 803 350 1400 4896 May-2019 116 865 861 709 326 169 2336 5382 Jun-2019 132 820 780 580 320 360 2648 5640 YTD 2,487 11,440 9,803 6,998 3,863 169 6,723 41,843
Bus Route Service Performance SCRTD RIDERSHIP - Fiscal Year 2019 - 2020 Added Service System Period BLUE RED PURPLE TURQUOISE ORANGE YELLOW GREEN Passenger Total Jul-2019 213 739 685 628 310 39 1735 4349 Aug-2019 162 1143 808 728 300 50 148 3339 Sep-2019 130 1160 828 782 340 3240 Oct-2019 152 1266 792 654 321 60 0 3245 Nov-2019 114 1177 801 589 320 171 3172 Dec-2019 0 Jan-2020 0 Feb-2020 0 Mar-2020 0 Apr-2020 0 May-2020 0 Jun-2020 0 YTD 771 5,485 3,914 3,381 1,591 89 1,883 17,345
Blue Route Performance Public Review The Blue Route has been in operation since February 2016 July 2018 bus route was shortened to reduce cost Ridership peaked in the August 2018 with 318 rides The cost of service is comparable to either the Purple or Turquoise bus routes with one operator and bus Recommend cutting service and saving the labor and fuel cost Shift resources to add late afternoon trip on Purple and Turquoise to attract more ridership
Handbook serves to support new Board Members with information on the District bylaws, intergovernmental agreement and bus service characteristics, financials and staffing Board of Directors Handbook Handbook can be updated annually with additional information
FY2020 Goals & Objectives Goal 1. Maintain and Expand a Safe and Efficient Public Transit System Based on the SCRTD s Available Funding, Performance Measures, and Planning Processes Goal 2. Coordinate with Local Governments, Employers, Other Government Entities, Non-Profits, and Transit Providers Within and Adjacent to the SCRTD. Goal 4. Implement and Use a Public Outreach and Education Plan and Develop a Long-Range Transit Plan Goal 3. Utilize a Progressive Financial Planning Process
Performance Matrix Five Financial and Service Plan Performance Measures PerformanceMeasure Measurable Standard 2019 Performance Accessibility MaintainADA accessibility on SCRTD buses All buses accessible Connectivity Establish and maintain connectivity with other transit systemsoperatingwithin and adjacentto the SCRTD Connectivitymaintained Rural PublicTransit Ridership Develop and maintain a ridership of at least 2,000 passengersper month Averaged 2456 pass/month TotalAdministration/OperationsRatio Maintainan A/O ratio of 0.24 or lower. Maintainedan A/O ratio of 0.29 CostPer PassengerTrip Maintaina costof $27 or lower CostPer PassengerTrip $7.42 Costper Vehicle mile Maintaina costof $1.00 or lower Costper Vehicle mile $0.93 RPO PrioritizationRanking Maintaina ranking of Highly Recommendedor better Received Highly Recommended Percentage of Previous Year s Federal Award Expended Maintainan expenditure of 100% Maintainedexpenditure of 100%
Sunland Park MOU The District has drafted an agreement with the City of Sunland Park to provide bus service in the Sunland Park to El Paso corridor. Currently service is provided on the 83 bus route Sunland Park maintains an agreement with the City of El Paso Agreement will support bus service in this region Recommend release of draft MOU and coordinate this effort with City staff
El Paso MPO Call for Projects District awarded $1,370,410 for purchase of two Hybrid-Electric buses Local match will come from legislature and/or County New service will generate new ridership to the District Buses delivered in twelve months

