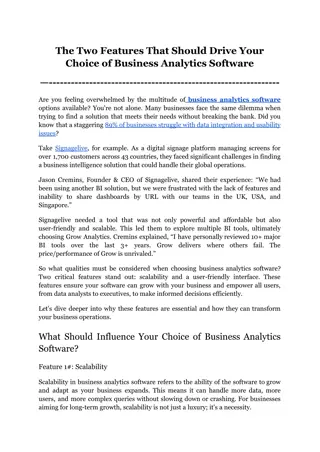
Business Analytics for Management Decision-Making
Dive into the world of business analytics with a focus on collecting, transforming, analyzing, and interpreting data to drive management decisions. Explore concepts like management decision-making, artificial intelligence, big data, and analytics for business decision-making.

Download Presentation

Please find below an Image/Link to download the presentation.
The content on the website is provided AS IS for your information and personal use only. It may not be sold, licensed, or shared on other websites without obtaining consent from the author. If you encounter any issues during the download, it is possible that the publisher has removed the file from their server.
You are allowed to download the files provided on this website for personal or commercial use, subject to the condition that they are used lawfully. All files are the property of their respective owners.
The content on the website is provided AS IS for your information and personal use only. It may not be sold, licensed, or shared on other websites without obtaining consent from the author.
E N D
Presentation Transcript
Business Analytics Understanding how to collect, transform, analyze, and interpret data to assist in management decision- making Business Analytics Wayne Smith, Ph.D. Department of Management CSU Northridge Updated: Wednesday, March 19, 2025 1
Management Decision-making (from a Quantitative perspective) Artificial Intelligence ( Machine Learning , Algorithms ) Business Research ( Statistics , Hypothesis Testing ) Big Data (generally, linked data in the cloud ) Data Science ( using reproducible tools for visualization/analysis ) Business Analytics ( simpler approaches, augments decisions ) Our task (at least from a technology perspective) is to Capture, transform, analyze, and report data, and In reporting, to be quite technical, copy-paste-adjust (for the audience) 2
Information Dynamics Wisdom Extraordinary Insight (Explanation) for Foresight (Prediction) Restaurant: How should our menu change in the future to best optimize nightly sales? Knowledge Combination of Explicit Information and Tacit Information Restaurant: What action led to the change in last night s sales? Information Meaningful Data Restaurant: How does last night s sales compare to that night the previous year? How does last night s sales compare to our goals? Data Raw, atomic, basic Restaurant: What were the total sales for last night? 4
Analytics for Business Decision- making Prescriptive Analytics What should we do? HR Department: What should we (the HR Department) do to meet or exceed the organization s hiring and retention goals for next year? What data/information/knowledge/wisdom should we provide to our hiring and technical managers to help? What are we missing? Predictive Analytics What is likely to happen? HR Department: How many new employees will our organization need next year? How will the mix change? What is our competition likely to do? Diagnostic Analytics Why did it happen? HR Department: Did our emphasis on recruiting from campus A (over campus B, etc.) matter? What do the managers of these entry-level employees think? Descriptive Analytics What happened? HR Department: How many entry-level professionals did we hire last year? How many of them are still with us now? 5
Your Analytics-related Courses Existing Course Type of Analytics Prescriptive Future Course SOM 306 (Operations) SOM (several), FIN, MKT SOM (mostly BANA), FIN, MKT Predictive MATH 140/SOM 120 (Basic Statistics) BUS 302 (Gateway) MATH 140/SOM 120 (Basic Statistics) BUS 302 (Gateway) MATH 140/SOM 120 (Basic Statistics) BUS 302 (Gateway) Diagnostic SOM (several), MKT Descriptive SOM (BANA) (Technology courses) IS 212 or CompSci 100 (Computers using Excel) 6
Your Future Analytics Knowledge Course Type of Analytics Prescriptive Existing Knowledge Linear Program- ming, Assignment, Portfolio Mixes Linear Regression Future Knowledge Mixed Integer Programming, Convex Optimization Multiple Regression, Non- linear, GLM Other Probability Distributions, Bayesian Methods Rich Visualization, Reproducible Reporting, Dashboards Operations Management (SOM 306) Predictive Basic Statistics Gateway Diagnostic Basic Statistics Gateway Inferential Statistics, Basic Probability Dist. Descriptive Basic Statistics Gateway Central Tendency, Dispersion, Basic Visualization 7
Excels Add-ins Type of Analytics Prescriptive Predictive Add-in Solver Data Analysis Feature Linear Programming Correlation, Regression, Moving Average, Exponential Smoothing Z-test, t-test, F-text, Anova, Random Number Generation, Sampling Rank and Percentile, Histogram, Covariance Diagnostic Data Analysis Descriptive Data Analysis (Enable) Select File | More | Options |Add-ins | Go (it s near the bottom) Check both the Analysis Toolkit box and the Solver add-in box (Use) Select Data (and look to the right of the top part of the screen) Click on Analysis or Solver as desired 8
Excels (Office 365) Analyze Data (look in the upper-right hand corner of the top Ribbon) Like grapahs, you select the data first Then it suggests various analyses Rank Trend Outliers Majority Which item is significantly larger or smaller than the rest? Which items form a significant pattern over time? Which items in time series might be outliers? Which items form a majority of a total value that can be attributed to a single factor? More information? https://support.microsoft.com/en-us/office/analyze-data-in-excel- 3223aab8-f543-4fda-85ed-76bb0295ffc4 9
From Analytics Knowledge to Analytics Skills Type of Analytics Existing Knowledge Prescriptive Linear Programming, Assignment, Portfolio Mixes Predictive Linear Regression Existing Skills MS-Excel (add-ins) Calculator (elementary), MS-Excel, GoogleDocs Calculator (elementary), MS-Excel, GoogleDocs Calculator (elementary), MS-Excel, GoogleDocs, Apple Numbers, LibreOffice (OpenOffice) Diagnostic Inferential Statistics, Basic Probability Dist. Descriptive Central Tendency, Dispersion, Basic Visualization 10
From Existing Analytics Skills to Future Analytics Skills Type of Analytics Skills Prescriptive MS-Excel (add- ins) Gurobi, MOSEK Future GUI Existing Skills Future CLI Skills IBM CPLEX, R (lpSolve, COINS) Python (pyomo, scipy.optimize) Julia (JuliaOpt, Convex) R (base, caret, tidymodels) Python (scikit-learn) Julia (GLM, MixedModels) R (base, MASS, tidymodels) Python (Statsmodels, PyMC) Julia (base, Statistics, Distributions) R (base, DT, tidyverse) Python (pandas, matplotlib, seaborn) Julia (base, DataFrames, Plots, StatsPlots) Predictive Calculator, MS- Excel, GoogleDocs Calculator, MS- Excel, GoogleDocs Alteryx, Microstrategy Diagnostic SAS, Stata, IBM SPSS, M-Plus MS-Power Tools, MS-Power BI, Tableau Descriptive Calculator, MS-Excel, GoogleDocs, Apple Numbers, LibreOffice 11
Access and Transform Access What is the source of the data (e.g., server, web page, etc.)? What is the format of the data (e.g., .xlsx file, .csv file, database file, etc.)? Is it public (no credentials) or private (need login credentials) Transform Rows: one per record?, how many?, any missing? Fields: one per variable?, how many?, any missing? Field Separators , Meta-data, links to other files, etc. In Data Science, this process is formally called Extract, Transform, and Load (ETL, for short) This must be done *before* any analysis can be done 12
Value Value means various superior outcomes, such as better decision-making, improved performance, realization of organizational objectives, and enhanced competitiveness, among others. 13
Difficulty Difficulty the problem being studied the challenges associated with extracting valuable knowledge from the data in a meaningful manner. many unknowns characterized by mutual dependencies between the variables very difficult to formulate. No established procedure (no rules) requires advanced technological capabilities, enhanced problem-formulation, and problem-solving skills from the workforce. 14
Complexity Complexity is is a measure of the amount of computing resources (with particular focus on time and memory requirements) that algorithms consume when they run. Note that complexity does not only necessarily stem from large or big data. Complexity can also arise when dealing with data for which computational need increases rapidly (i.e., the procedure to solve the problem involves a computationally intensive algorithm that requires a relatively large number of steps to complete.) 15
Requirements for Analytics Models Independent of the application area, certain requirements should be considered while developing analytics models. These requirements include business relevance, statistical performance (predictive capacity in terms of relevant performance measures), interpretability, explainability, justifiability, operational efficiency, Running/completion time, and economic cost. All of the above are trade-offs More of one generally means less of another 16
Big Data Big data pose a series of challenges which stem from their characteristics: Volume (they have many variables and/or many observations, Velocity (they are created and updated frequently, Variety (they are of all different types, Veracity (they are all of different quality. As a result, performing data analytics on massive data sets becomes more challenging. Data Analytics can also be performed on qualitative (words) data. For example, we look for patterns or distinctiveness in the narrative. Useful in Law and Marketing. 17
When Descriptive Analytics Goes Wrong Descriptive Analytics 18
When Diagnostic Analytics Goes Wrong Diagnostic Analytics 21
When Predictive Analytics Goes Wrong Predictive Analytics 23
When Prescriptive Analytics Goes Wrong Prescriptive Analytics 25
Sources Some parts of this presentation were excerpted and adapted from: Charles, V., et .al (December, 2022) Why Data Analytics is an Art. Significance (Royal Statistical Society) (volume 9, issue 16, pp. 42-45) 27


 “Analyze")