Business Cycles and Unemployment Overview
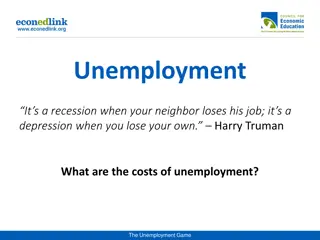
The content delves into the concepts of business cycles, focusing on the phases like peak, trough, recession, recovery, and their impact on real GDP and unemployment. It outlines the historical context of depressions and post-World War II recessions, offering insights into economic fluctuations and growth patterns. The visuals and data provided give a comprehensive understanding of how the economy evolves through varying cycles.

Download Presentation

Please find below an Image/Link to download the presentation.
The content on the website is provided AS IS for your information and personal use only. It may not be sold, licensed, or shared on other websites without obtaining consent from the author.If you encounter any issues during the download, it is possible that the publisher has removed the file from their server.
You are allowed to download the files provided on this website for personal or commercial use, subject to the condition that they are used lawfully. All files are the property of their respective owners.
The content on the website is provided AS IS for your information and personal use only. It may not be sold, licensed, or shared on other websites without obtaining consent from the author.
E N D
Presentation Transcript
Business Cycles and Unemployment
Business Cycle Alternating periods of economic growth and contraction, which can be measured by changes in real GDP Four phases of a business cycle Peak Recession Trough Recovery
Peak the phase of the business cycle during which real GDP reaches its maximum after rising during a recovery Economic growth an expansion in national output measured by the annual percentage increase in a nation s real GDP Why is growth an economic goal? it increases our standard of living - it creates a bigger economic pie
Trough the phase of the business cycle in which real GDP reaches its minimum after falling during a recession Recession a downturn in the business cycle during which real GDP declines Government Recession Definition at least two consecutive quarters in which GDP declines
The Depression The term depression is primarily an historical reference to the extreme deep and long recession of the early 1930 s Recovery An upturn in the business cycle during which real GDP rises
Hypothetical Business Cycle Peak Real GDP Peak Trough Recession Recovery
Post-World War II Recessions Recession Dates Nov 1948-Oct 1949 July 1953 May 1954 Aug 1957 Apr 1958 Apr 1960 Feb 1961 Duration 11 10 8 10 % Decline in GNP -1.7 -2.7 -1.2 -1.6 Peak Unemployment Rate 7.9% 5.9 7.4 6.9 Dec 1969 Nov 1970 Nov 1973 Mar 1975 Jan 1980 July 1980 July 1981 Nov 1982 July 1990 Mar 1991 Mar 2001 Nov 2001 Mar. 2001 - Nov. 2001 Dec. 2007-June 2009 Average 11 16 6 16 8 8 16 18 11 -0.6 -3.1 -2.2 -2.9 -1.3 -0.5 -3.5 -4.1 -2.0 5.9 8.6 7.8 10.8 6.8 5.6 9.5 9.7 7.6
Business Cycles in the U.S. 1929-2010 Annual Real GDP Growth Rate (percent) 20 Annual real GDP growth 15 Long-term average growth 10 5 3.5 0 Zero growth -5 -10 -15 `29 `30 `35 `40 `45 `50 `55 `60 `65 `70 `75 `80 `85 `90 `95 `00 `05 `10 `15
Three types of economic indicators Leading Coincident Lagging Leading Indicator Variables that change before real GDP changes Average workweek New building permits Changes in inventories Material prices Stock prices Money supply Changes in business and consumer credit New orders for plant and equipment New consumer goods orders Unemployment claims Delayed deliveries New business formed
Coincident Indicator Variables that change at the same time that real GDP changes Nonagricultural payrolls Personal income Industrial Production Manufacturing and trade sales Lagging Indicator Variables that change after real GDP changes Unemployment rate Duration of unemployment rate Labor cost per unit of output Inventories to sales ratio Outstanding commercial loans Commercial credit to personal income ratio Prime interest rate
Civilian Labor Force People 16 years or older who are either employed or unemployed, excluding members of the armed forces and people in institutions Who is considered employed? Anyone who works at least one hour a week for pay or at least 15 hours per week as an unpaid worker in a family business
Primary Cause of Unemployment When total spending falls, businesses will find it profitable to produce a lower volume of goods and avoid unsold inventory Who is considered unemployed? Anyone who is 16 years of age and above who is actively seeking employment
Total Population age 16 and over Civilian labor force Not in Labor Force Employed Employees Self-employed Armed forces Household workers Students Retirees Persons with disabilities Institutionalized Discourage workers Unemployed New entrants Re-entrants Lost last job Quit last job Laid off
Unemployment rate The percentage of people in the labor force who are without jobs and are actively seeking jobs unemployed civilian labor force = Unemployment rate X 100 Calculated 60,000 households are surveyed each month Where to find current unemployment rate? http://www.bls.gov http://www.bls.gov
Current Population Estimates Civilian non- institutional population 212,577 215,092 217,570 221,168 223,357 226,082 228,815 231,867 233,788 235,801 237,830 Unemployment Rate 4.0 4.7 5.8 6.0 5.5 5.1 4.6 4.6 5.8 9.3 9.6 Not in Labor Force 69,994 71,359 72,707 74,658 75,956 76,762 77,387 78,743 79,501 81,659 83,941 Year 2000 2001 2002 2003 2004 2005 2006 2007 2008 2009 2010 Labor Force Unemployed 142,583 143,734 144,863 146,510 147,401 149,320 151,428 153,124 154,287 154,142 153,889 5,692 6,801 8,378 8,774 8,149 7,591 7,001 7,078 8,924 14,265 14,825 = Unemployment rate unemployed civilian labor forceX 100 = 14,825 153,889 X 100 9.6%
Discouraged Worker a person who wants to work, but who has given up searching for work Underemployment people working at jobs below their level of skills Criticisms of the Unemployment Rate Does not include discouraged workers Includes part-time workers Does not measure underemployment
U.S. Unemployment Rate 1929-2014 25 U.S. Unemployment Rate 20 (percent) 15 10 5 0 1930 1940 1950 1960 1970 1980 1990 2000 2010
Types of Unemployment Seasonal Frictional Structural Cyclical Seasonal Unemployment Unemployment caused by recurring changes in hiring due to changes in weather conditions
Frictional Unemployment Normal search time required by workers with marketable skills who are changing jobs, entering, or re-entering the labor force Structural Unemployment A mismatch between unemployed worker skills and the skills required for existing job opportunities Cyclical Unemployment Unemployment caused by the lack of jobs during a recession
Full Employment Unemployment equals the sum of seasonal, frictional, and structural unemployment What is considered full employment? The natural rate of unemployment changes over time, but today it is considered to be about 3% - 5% GDP Gap The difference between full-employment real GDP and actual real GDP
Cost of Unemployment GDP Gap - the gap between actual and potential real GDP measures the monetary losses of real goods and services when at less than full employment 16 14 GDP GAP (positive) 13 GDP GAP (negative) Actualreal GDP 12 11 Potential real GDP 10 `97 `98 `99 `00 `01 `02 `03 `04 `05 `06 `07 `08 `09 `10 `11 `12 `13 `14