Business Financial Analysis and Calculation Guide
Learn how to calculate key financial metrics such as gross profit margin, variance in profit, contribution per unit, break-even output, and margin of safety using practical examples and formulas. Enhance your understanding of financial performance and decision-making in business operations.

Download Presentation

Please find below an Image/Link to download the presentation.
The content on the website is provided AS IS for your information and personal use only. It may not be sold, licensed, or shared on other websites without obtaining consent from the author. If you encounter any issues during the download, it is possible that the publisher has removed the file from their server.
You are allowed to download the files provided on this website for personal or commercial use, subject to the condition that they are used lawfully. All files are the property of their respective owners.
The content on the website is provided AS IS for your information and personal use only. It may not be sold, licensed, or shared on other websites without obtaining consent from the author.
E N D
Presentation Transcript
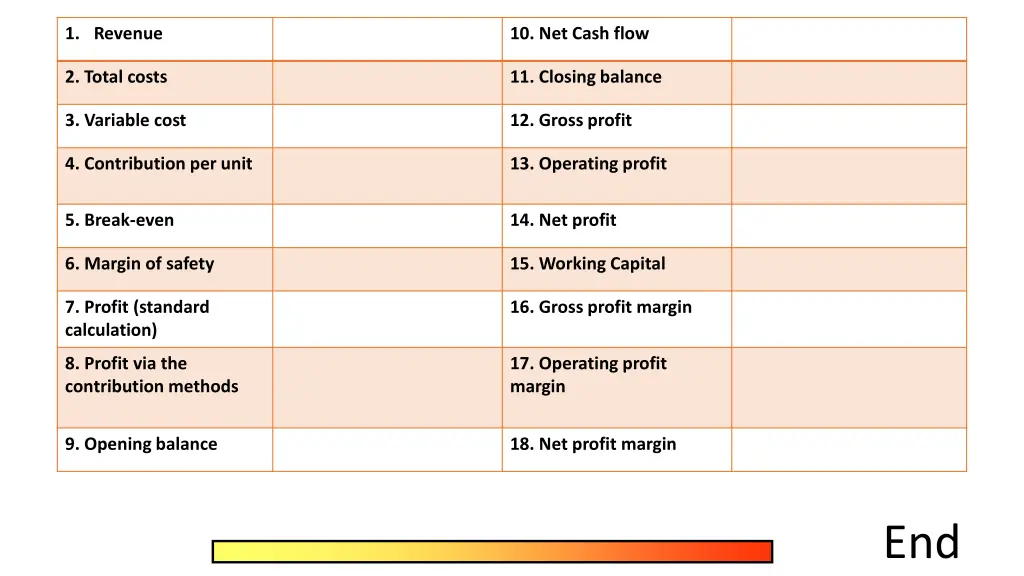
1. Revenue 10. Net Cash flow 2. Total costs 11. Closing balance 3. Variable cost 12. Gross profit 4. Contribution per unit 13. Operating profit 5. Break-even 14. Net profit 6. Margin of safety 15. Working Capital 7. Profit (standard calculation) 16. Gross profit margin 8. Profit via the contribution methods 17. Operating profit margin 9. Opening balance 18. Net profit margin End
Revenue Selling Price x amount sold Net Cash flow Inflows - outflows Total costs Fixed costs + Variable cost Closing balance Net cash flow + opening balance Variable cost Variable cost per unit x output Gross profit Revenue cost of sales Contribution per unit Selling price variable cost per unit Operating profit Gross profit fixed overheads Break-even Fixed cost/contribution per unit Net profit (before tax) Operating profit finance/exceptional costs & tax Margin of safety Actual output break-even output Working capital Current assets current liabilities Profit (standard calculation) Revenue total cost Gross profit margin Gross profit/revenue x 100 Profit via the contribution methods Total contribution fixed cost Operating profit margin Operating profit/revenue x 100 Opening balance Last months closing balance Net profit margin Net profit/ revenue x 100
Calculate the gross profit margin. Revenue = 2523.2 Cost of sales = 757.7 Other operating expenses = 1325.2 Operating profit = 440.3 2523.3 757.7 = 1765.5 gross profit 1765.5/2523.2 = 69.97% gross profit margin
A business has a maximum output of 34,200 per year. Using the data below calculate a) the total number of products actually produced. b) the variance in profit Budgeted sales revenue 12 250 Actual sales revenue 14370 Budgeted total costs 4210 Actual total costs 5890 Capacity utilisation 92% a) 34,200/100 x 92 or 34200 x 0.92 = 31364 b) 14370 12250 = 2120 favourable 5890 4210 = 1680 adverse 2120 1680 = 440 favourable profit varience
Average selling price: 4 Variable cost per unit: 1.50 Total fixed costs: 50,000 Planned output: 25,000 Using the data above, calculate the following: a. Contribution per unit b. Total contribution if planned output is sold c. Break-even output d. Margin of safety if planned output is sold
Average selling price: 4 Variable cost per unit: 1.50 Total fixed costs: 50,000 Planned output: 25,000 Using the data above, calculate the following: a. Contribution per unit 4-1.50 = 2.50 b. Total contribution if planned output is sold = 2.50 x 25,000 = 62,500 c. Break-even output = 50,000 /2.50 = 20,000 d. Margin of safety if planned output is sold 25,000 20,000 = 5,000 units
1. What is this firms price? 100/10 = 10 2. Break-even output? 4 units 3. What is their margin of safety if six units are sold? Two units 4. What profit/loss will be made if eight units are sold? 80 60 = 20 5. What percentage of total costs at 9 units of output are fixed? 20/64 x 100 = 31.25%
6. Imagine fixed costs double. Amend the diagram above and calculate the new break-even output.
A formal financial document that summarises the net worth of a business at a given point in time. It balances net assets with total equity A formal financial document that summarises a business trading activities and expenses to show whether the business has made a profit or a loss As well as the bottom line i.e. the profit or loss it can also be used to analyse profit margins The process of estimating the size and timing of cash inflows and outflows within a business Shows the predicted net cash flow and opening and closing balance at set points in time, normally monthly. A target amount of money set by a business to be achieved (sales) or adhered to (expenditure) in a specific period of time Managing a budget involves comparing actual results to target results and investigating any differences A budget can be: Expenditure amount to be spent Income amount to be received Profit amount of surplus required from sales revenue after Statement of Comprehensive Income (Profit and Loss Account) Statement of Financial Position (Balance Sheet) Budget Cash flow forecast
Statement of Financial Position (Balance Sheet) A formal financial document that summarises the net worth of a business at a given point in time. It balances net assets with total equity Statement of Comprehensive Income (Profit and Loss Account) A formal financial document that summarises a business trading activities and expenses to show whether the business has made a profit or a loss As well as the bottom line i.e. the profit or loss it can also be used to analyse profit margins Cash-flow Forecast The process of estimating the size and timing of cash inflows and outflows within a business Shows the predicted net cash flow and opening and closing balance at set points in time, normally monthly. Budget A target amount of money set by a business to be achieved (sales) or adhered to (expenditure) in a specific period of time Managing a budget involves comparing actual results to target results and investigating any differences A budget can be: Expenditure amount to be spent Income amount to be received Profit amount of surplus required from sales revenue after
Look at the following financial documents. Identify what they are and explain why businesses create them. List whetherthereare any other financial analysis calculations that we use to manipulate the data from these documents. 1. Document name: 2. Why do businesses create it?: 3. What additional formulas do we use to analyse this document?
1. Document name: 2. Why do businesses create it?: 3. What additional formulas do we use to analyse this document?
1. Document name: 2. Why do businesses create it?: 3. What additional formulas do we use to analyse this document?
Create a list of the sources and methods of Create a list of the sources and methods of finance finance List the sources of finance (i.e. who) List the methods of finance (i.e. how)
List the sources of finance (i.e. who) List the methods of finance (i.e. how) Bank Loan Peers Trade credit Family and friends Lease Venture capitalist Share Capital Business Angels Mortgages Crowd Funding Venture Capital Other Businesses Overdraft Grants
Advantages an disadvantages of low levels of stock Advantages Disadvantages
Advantages an disadvantages of low levels of stock Advantages Disadvantages Lower stock holding costs (e.g. storage) May not be able to meet consumer demand (stock out) Lower risk of stock obsolescence Missed opportunity for achieving economies of scale Less capital (cash) tied up in working capital can be used elsewhere in the business Consistent with operating lean
Advantages and disadvantage of batch production. Advantages Disadvantages
Advantages and disadvantage of batch production. Advantages Disadvantages Cost savings can be achieved by buying in bulk Takes time to switch production of one batch to another Still allows customers some choice Requires the business to maintain higher stocks of raw materials and work-in-progress Products can be worked on by specialist staff or equipment at each stage Tasks may become boring (repetitive) reducing motivation Allows a firm to handle unexpected orders Size of batch dependent on capacity allocated


")