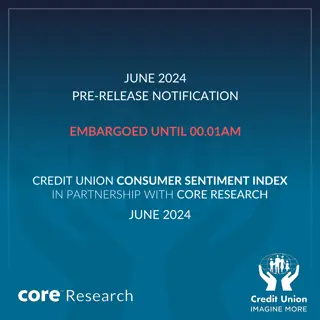
Business Performance and Guest Trends Q1 2025
Reflecting on Q1 2025, businesses in the Peak District and Derbyshire showed cautious optimism in their performance. 40% reported improvements, with 43% anticipating better performance in the next six months. Revenue and visitor numbers varied, with 49% seeing an increase in revenue and 54% reporting stable or increased visitor numbers. Visitor behavior leaned towards short-term planning, with 51% of businesses noting pre-booking trends.

Download Presentation

Please find below an Image/Link to download the presentation.
The content on the website is provided AS IS for your information and personal use only. It may not be sold, licensed, or shared on other websites without obtaining consent from the author. If you encounter any issues during the download, it is possible that the publisher has removed the file from their server.
You are allowed to download the files provided on this website for personal or commercial use, subject to the condition that they are used lawfully. All files are the property of their respective owners.
The content on the website is provided AS IS for your information and personal use only. It may not be sold, licensed, or shared on other websites without obtaining consent from the author.
E N D
Presentation Transcript
Business sentiment Q1 2025
Key Findings Business performance Forty percent of businesses reported that their overall performance over the past six months was either much better or slightly better compared to the previous six months. An additional 37% said performance remained the same, while 20% noted it was slightly worse and only 3% reported it was significantly worse. When businesses were asked how they expect the next six months to compare to the previous period, 43% anticipated their performance would be much better or slightly better. Another 34% expected it to remain the same, while 17% predicted it would be slightly worse. Only 3% expected a significant decline, and the remaining 3% were uncertain about what to expect. Forty-nine percent of businesses reported an increase in revenue compared to the same period last year, while 20% saw no change and 31% experienced a decline. To manage rising costs, 63% of businesses have increased their prices by up to 10%, while 51% have postponed investment, building projects, or maintenance work.
Key Findings Guests & Visitors Fifty-four percent of businesses reported that visitor numbers were either stable or had increased. Meanwhile, 43% noted a decline, with 11% of those indicating a significant drop. The remaining 3% were unsure. Fifty-one percent of businesses reported that more than 75% of their guests or visitors pre-book. Booking lead times were reported to be generally short, with 37% of bookings made within seven days of the visit or stay, including 27% made within 48 hours. Twenty-nine percent of businesses cited a lead time of two to four weeks, while 17% reported bookings typically occurred two to three months in advance. The remaining 16% either indicated other lead times or were unsure. Older couples made up the largest visitor demographic, with 86% of businesses reporting guests from this group. This was closely followed by families with young children, cited by 67% of businesses.
Key Findings Guests & Visitors one to three hours to reach their destination. The majority of visitors were reported to have travelled from within the UK, typically journeying Forty-three percent of businesses reported welcoming international visitors.
Key Findings Business Sentiment Survey Summary (Q1 2025) Businesses across the Peak District and Derbyshire reflected on their performance during Q1 2025 (January to March), with sentiment showing cautious optimism. Forty percent reported that their overall performance during this period was either much better or slightly better compared to the previous six months. An additional 37% noted no change, while 20% experienced a slight decline and 3% reported a significant drop. Looking ahead, 43% of businesses anticipated improved performance over the next six months, while 34% expected conditions to remain the same. Seventeen percent foresaw a slight downturn, and 3% anticipated a significant decline. The remaining 3% were uncertain about future prospects. Revenue comparisons to the same period last year were mixed: 49% of businesses reported an increase, 20% saw no change, and 31% experienced a decline. Visitor numbers followed a similar trend, with 54% reporting stable or increased figures, while 43% observed a decrease including 11% who described it as considerable. Just 3% were unsure. Visitor behaviour continued to reflect short-term planning, with 51% of businesses stating that over 75% of their guests pre-booked. Booking lead times were generally short: 37% of bookings were made within seven days of the visit, including 27% within 48 hours. Meanwhile, 29% reported bookings occurring two to four weeks in advance, and 17% said their typical lead time was two to three months. The remaining 16% indicated varying lead times or were unsure. In terms of visitor demographics, older couples remained the most prevalent group, reported by 86% of businesses, followed by families with young children at 67%. Most visitors travelled domestically, typically journeying one to three hours to reach the area, though 43% of businesses also reported welcoming international guests.
Q1: Which of the following best describes your business? Self-catering accommodation provider Hotel B&B / Guest House Self-catering accommodation provider Camping, glamping, caravanning Site Visitor Attraction Activity / Experience Provider Caf , Bar or Restaurant Retail Theatre, music venue, cinema Festival/Event organiser Conference/Business venue Other (please specify) 0% 10% 20% 30% 40% 50% 60% 70% 80% 90% 100%
Q2: Where is your business located? Urban Rural Coastal 0% 10% 20% 30% 40% 50% 60% 70% 80% 90% 100%
Q3: Which Local Authority is your business located in? Amber Valley Borough Council Bolsover District Council Cheshire East Council Chesterfield Borough Council Derbyshire Dales District Council Derby City Council Erewash Borough Council High Peak Borough Council North East Derbyshire District Council South Derbyshire District Council Staffordshire Moorlands District Council Sheffield City Region 0% 10% 20% 30% 40% 50% 60% 70% 80% 90% 100%
Q4: Including yourself, how many people are employed by your business (in this area)? 1 - 9 employees (Micro) 10 - 49 employees (Small) 50 - 249 employees (Medium) 250 or more employees (Large) 0% 10% 20% 30% 40% 50% 60% 70% 80% 90% 100%
Q5: Which of these groups is your annual turnover in? [Please note the survey is anonymous and all information will remain confidential] Less than 100,000 100,000 - 249,000 250,000 - 999,000 1 - 5 million 6 - 10 million More than 10 million Don t know / Prefer not to say 0% 10% 20% 30% 40% 50% 60% 70% 80% 90% 100%
Q6: How has your business performance in the last 6 months compared to the previous 6 months? Much better A little better The same A little worse A lot worse Don't know 0% 10% 20% 30% 40% 50% 60% 70% 80% 90% 100%
Q7: Looking forward to the next 6 months, how do you expect your business performance to compare with the last 6 months? Much better A little better The same A little worse A lot worse Don't know 0% 10% 20% 30% 40% 50% 60% 70% 80% 90% 100%
Q8: How have your visitor numbers been over the last quarter, compared to the same quarter last year? Considerably up Slightly up The same Slightly down Considerably down Don't know 0% 10% 20% 30% 40% 50% 60% 70% 80% 90% 100%
Q9: How has your revenue changed compared to last year? Considerably up Slightly up The same Slightly down Considerably down Don't know 0% 10% 20% 30% 40% 50% 60% 70% 80% 90% 100%
Q10: What proportion of your visitors pre-book? Under 10% 10% to 25% 26% to 50% 51% to 75% Over 75% Don't know 0% 10% 20% 30% 40% 50% 60% 70% 80% 90% 100%
Q11: What is the current lead time on the majority of booking being made? On the day 24 hours in advance 48 hours in advance 7 days in advance 2-4 weeks in advance 2-3 months in advance Other Don't know 0% 10% 20% 30% 40% 50% 60% 70% 80% 90% 100%
Q12: What type of people visit/stay with you? (Please tick all that apply) Don't know Business travellers Solo travellers Organised groups Younger couples/friendship groups Older couples Families with young children Families with older children 0% 10% 20% 30% 40% 50% 60% 70% 80% 90% 100%
Q13: Where have your visitors have travelled from? (Please tick all that apply) Don t know Local area (within 1 hr drivetime) 1 - 3 hours drive time (in UK) More than 3 hours (in UK) International 0% 10% 20% 30% 40% 50% 60% 70% 80% 90% 100%
Q14: To what extent do you believe that the current state of the UK economy is impacting your business performance? Very positively Positive Neutral Negatively Very negatively Don't know 0% 10% 20% 30% 40% 50% 60% 70% 80% 90% 100%
Q15: How is your business responding to increasing costs (if applicable)? (Please tick all that apply) Not sure Increased prices by up to 10% Cut costs by reducing staff Cut costs by delaying investment, building or maintenance works Increased prices by more than 10% Increasing revenue by opening for longer Increasing secondary spend (e.g. shop, bar, cafe revenue) Cut costs by reducing opening hours or closing certain days of the week Cut costs by closing for the winter period 0% 10% 20% 30% 40% 50% 60% 70% 80% 90% 100%
Q16: What is the biggest concern for your business over the next six months? Guest numbers Infrastructure Recruitment of staff Interest rates Cost Lack of skills and training Access to finance High energy costs Poor economic climate / less money in consumer pockets Other (please specify) 0% 10% 20% 30% 40% 50% 60% 70% 80% 90% 100%
Q17: If you are an accommodation provider what is the average length of stay of your guests? I am not an accommodation provider 1-2 nights 3-4 nights 7 nights More than 7 nights Don't know 0% 10% 20% 30% 40% 50% 60% 70% 80% 90% 100%
Q18: Are your visitor numbers/occupancy rates this year up, level with, or down compared to last year? Up a lot Up a little Level with/unchanged Down a little Down a lot Don't know 0% 10% 20% 30% 40% 50% 60% 70% 80% 90% 100%