Calculate Least Squares Regression Line
Learn how to calculate a least squares regression line using the formula and a graphing calculator. Understand the concept of residuals and how to improve the accuracy of your regression line. Use a graphical calculator to find the equation of the regression line based on given data points.

Download Presentation

Please find below an Image/Link to download the presentation.
The content on the website is provided AS IS for your information and personal use only. It may not be sold, licensed, or shared on other websites without obtaining consent from the author. If you encounter any issues during the download, it is possible that the publisher has removed the file from their server.
You are allowed to download the files provided on this website for personal or commercial use, subject to the condition that they are used lawfully. All files are the property of their respective owners.
The content on the website is provided AS IS for your information and personal use only. It may not be sold, licensed, or shared on other websites without obtaining consent from the author.
E N D
Presentation Transcript
Linear Regression LO: How to calculate a least squares regression line using the formula and the GDC.
The least squares regression line Before you have learned that a line of best fit is drawn to describe correlation which was a bit of a guessing game a bit hit and miss. But now you will learn a slightly more accurate method the method of least squares to calculate the line of regression. Linear Least Square Regression is a method of fitting an affine line to a set of data points.
We construct the scatter diagram to illustrate the data, Mean Point (8.6, 79.6) Find the mean point 5 12 7 10 10 9 8 11 6 8 Size 65 97 68 92 78 78 76 88 74 80 Mass And draw the line of best fit. 100 Inaccuracies occur because we only have one point to draw the line through and the line of best fit is then drawn by eye . 95 90 85 Mass (kg) 80 75 70 65 There is another way to improve our line, involving residuals 60 8 9 10 11 12 13 6 7 Shoe Size 4 5
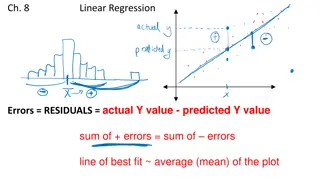
Residuals A residual is the vertical distance between observed y-value and the predicted y-value using the line of regression. Residuals are shown by a vertical line from the line of regression. y Positive Residual If the point is above the graph Zero Residual If the graph pass through the data point Actual data point (xi, yi) Negative Residual If the point is below the graph Residual yi - yp Predicted data point (xp, yp) x
The equation of the Regression line of y on x The least squares regression line is the one that has the smallest possible value for the sum of the squares of the residuals. In the diagram we aim to make a2 + b2 + c2 + d2 + e2 + f2 + g2 + h2 + i2 + j2 + k2 + l2. As close to zero as possible y In this course we are going to use a graphics calculator to find the equation of the least squares regression line f k l e j d hi c b g a x
Use the Graphics calculator to find the equation of the regression line 10 10 7 12 5 9 8 11 6 8 Size 65 97 68 92 78 78 76 88 74 80 Mass We are going to use the GDC to find the equation of the regression line 100 Turn on the GDC Press 2 95 Statistics 90 85 Mass (kg) 80 75 70 65 60 8 9 10 11 12 13 6 7 Shoe Size 4 5
Use the Graphics calculator to find the equation of the regression line 10 10 7 12 5 9 8 11 6 8 Size 65 97 68 92 78 78 76 88 74 80 Mass We are going to use the GDC to find the equation of the regression line 100 Type the values of size in the list 1 95 Type the values of mass in the list 2 90 85 Mass (kg) 80 75 70 65 60 8 9 10 11 12 13 6 7 Shoe Size 4 5
Use the Graphics calculator to find the equation of the regression line 10 10 7 12 5 9 8 11 6 8 Size 65 97 68 92 78 78 76 88 74 80 Mass We are going to use the GDC to find the equation of the regression line 100 95 F2 CALC 90 85 Mass (kg) 80 75 70 65 60 8 9 10 11 12 13 6 7 Shoe Size 4 5
Use the Graphics calculator to find the equation of the regression line 10 10 7 12 5 9 8 11 6 8 Size 65 97 68 92 78 78 76 88 74 80 Mass We are going to use the GDC to find the equation of the regression line 100 95 F3 REG 90 85 Mass (kg) 80 75 70 65 60 8 9 10 11 12 13 6 7 Shoe Size 4 5
Use the Graphics calculator to find the equation of the regression line 10 10 7 12 5 9 8 11 6 8 Size 65 97 68 92 78 78 76 88 74 80 Mass We are going to use the GDC to find the equation of the regression line 100 95 F1 X 90 85 Mass (kg) 80 75 70 65 60 8 9 10 11 12 13 6 7 Shoe Size 4 5
Use the Graphics calculator to find the equation of the regression line 10 10 7 12 5 9 8 11 6 8 Size 65 97 68 92 78 78 76 88 74 80 Mass We are going to use the GDC to find the equation of the regression line 100 95 F1 ax + b 90 85 Mass (kg) 80 75 70 65 60 8 9 10 11 12 13 6 7 Shoe Size 4 5
Use the Graphics calculator to find the equation of the regression line 10 10 7 12 5 9 8 11 6 8 Size 65 97 68 92 78 78 76 88 74 80 Mass We are going to use the GDC to find the equation of the regression line 100 y = ax + b 95 a = 4.09 b = 44.5 ? = 4.09? + 44.5 90 85 Mass (kg) 80 75 70 65 60 8 9 10 11 12 13 6 7 Shoe Size 4 5
Use the Graphics calculator to find the equation of the regression line 10 10 7 12 5 9 8 11 6 8 Size 65 97 68 92 78 78 76 88 74 80 Mass We are going to use the GDC to find the equation of the regression line 100 In the information screen there is a value r = 0.8953974 95 This is called Pearson s correlation coefficient 90 85 Mass (kg) 80 75 70 65 60 8 9 10 11 12 13 6 7 Shoe Size 4 5
Use the Graphics calculator to find the equation of the regression line 10 10 7 12 5 9 8 11 6 8 Size 65 97 68 92 78 78 76 88 74 80 Mass We are going to use the GDC to find the equation of the regression line 100 r = 0.8953974 95 It is very useful as it tells us the strength and direction of the linear correlation 90 85 Mass (kg) 80 75 70 65 60 8 9 10 11 12 13 6 7 Shoe Size 4 5
Pearsons correlation coefficient The values of r range from 1 to 1 The sign of r indicates the direction of the correlation. A positive value of r indicates the variables are positively correlated A negative value of r indicates the variables are negatively correlated The size of r indicates the strength of the correlation. A value of r close to +1 or 1 indicates strong correlation between the variables A value of r close to zero indicates weak correlation between the variables
Use the Graphics calculator to find the equation of the regression line 10 10 7 12 5 9 8 11 6 8 Size 65 97 68 92 78 78 76 88 74 80 Mass We are going to use the GDC to find the equation of the regression line 100 In the information screen there is a value r2 = 0.8017365 95 This is called coefficient of determination 90 85 Mass (kg) 80 75 70 65 60 8 9 10 11 12 13 6 7 Shoe Size 4 5
Coefficient of determination The following table is a guide for describing the strength of linear correlation using the coefficient of determination Value r2 = 0 0 < r2< 0.25 0.25 r2< 0.5 0.5 r2< 0.75 0.75 r2< 0.9 0.5 r2< 1 r2 = 1 Strength of correlation No correlation Very weak correlation Weak correlation Moderate correlation Strong correlation Very strong correlation Perfect correlation
Thank you for using resources from A close up of a cage Description automatically generated For more resources visit our website https://www.mathssupport.org If you have a special request, drop us an email info@mathssupport.org Get 20% off in your next purchase from our website, just use this code when checkout: MSUPPORT_20