Calculating AIA Alpha in Excel: Step-by-Step Guide for Data Analysis
Learn how to calculate AIA Alpha using Excel with this detailed step-by-step guide. Open your SPSS dataset, request a correlation matrix, transfer data to Excel, delete unnecessary information, and complete the analysis easily.

Download Presentation

Please find below an Image/Link to download the presentation.
The content on the website is provided AS IS for your information and personal use only. It may not be sold, licensed, or shared on other websites without obtaining consent from the author.If you encounter any issues during the download, it is possible that the publisher has removed the file from their server.
You are allowed to download the files provided on this website for personal or commercial use, subject to the condition that they are used lawfully. All files are the property of their respective owners.
The content on the website is provided AS IS for your information and personal use only. It may not be sold, licensed, or shared on other websites without obtaining consent from the author.
E N D
Presentation Transcript
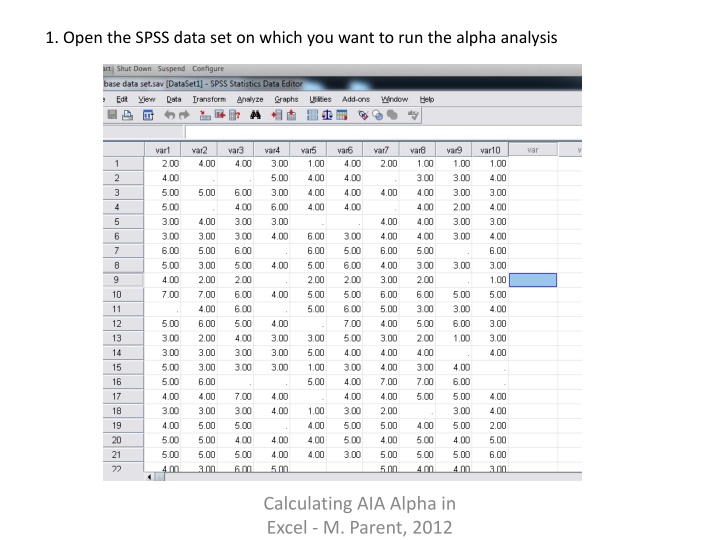
1. Open the SPSS data set on which you want to run the alpha analysis Calculating AIA Alpha in Excel - M. Parent, 2012
2. Request a correlation matrix of the items for which you want an alpha. Ask for cross- products and exclude data pairwise. Calculating AIA Alpha in Excel - M. Parent, 2012
3. Youll get a large table as output. Calculating AIA Alpha in Excel - M. Parent, 2012
4. Copy and paste the table to excel Calculating AIA Alpha in Excel - M. Parent, 2012
5. Delete the extra infoeverything except the covariance line. Calculating AIA Alpha in Excel - M. Parent, 2012
6. Delete the bottom left triangle of the matrix (but keep the diagonal). Calculating AIA Alpha in Excel - M. Parent, 2012
7. Copy and paste the upper right triangle into the excel calculator Calculating AIA Alpha in Excel - M. Parent, 2012
8. Enter the number of variables into the calculator. Done! Calculating AIA Alpha in Excel - M. Parent, 2012