Calculating Customer Acquisition Cost (COCA) for a New Venture
Learn how to calculate Customer Acquisition Cost (COCA) for a new venture by considering marketing expenses, customer retention costs, and new customer acquisition. Follow an example scenario of Associated Gas Energy to understand the process better.

Uploaded on | 1 Views
Download Presentation

Please find below an Image/Link to download the presentation.
The content on the website is provided AS IS for your information and personal use only. It may not be sold, licensed, or shared on other websites without obtaining consent from the author. If you encounter any issues during the download, it is possible that the publisher has removed the file from their server.
You are allowed to download the files provided on this website for personal or commercial use, subject to the condition that they are used lawfully. All files are the property of their respective owners.
The content on the website is provided AS IS for your information and personal use only. It may not be sold, licensed, or shared on other websites without obtaining consent from the author.
E N D
Presentation Transcript
Entrepreneurship for Computer Science CS 15-390 Financial Intelligence- Part I Lecture 18, March 30, 2020 Mohammad Hammoud
Today Last Session: LTV- Part II and COCA (Intro.) Today s Session: COCA (Conclude) and Financial Intelligence- Part I Announcements: PS3 is due on April 1 by midnight I will have office hours from 3:30PM till 6:00PM over Zoom on Wednesday, April 1
How to Calculate COCA? To calculate COCA, you need three metrics: 1. Total Marketing and Sales Expenses over Time or TMSE(t) 2. Install Base Support Expense over Time or IBSE(t) This is the cost to retain existing customers 3. New Customers over Time or NC(t) COCA = (TMSE(t) IBSE(t))/NC(t) COCA is typically calculated over 3 consecutive time periods, namely, short-term (e.g., 1styear of sales), medium-term (e.g., 2ndand 3rdyears of sales), and long-term (e.g., 4thand 5thyears of sales) periods Depending on your venture, these time periods may be different!
Example: Associated Gas Energy Oil drilling typically produces associated gas as well, which is costly to deal with and problematic for the environment Assume a new venture, namely, Associated Gas Energy, with a GTL (Gas To Liquid) technology to convert associated gas into crude oil at a cost of $70 to a conservative customer The customer can be convinced to buy using old-fashioned direct sales methods, especially at the beginning
Example: Associated Gas Energy Year 1 Plan: Hire an experienced sales person (say, full package at $175K/year) Hire a tech sales support person (say, full package at $125K/year) Hire a consultant to help break through the initial customer inertia and to get all regulatory issues taken care of (say, full package at $150K/year) Spend on travel (say, $24K), develop ad material (say, $15K), conduct a trade show (say, $30K), and develop a website (say, $10K) Expected number of customers is 1
Example: Associated Gas Energy Years 2 & 3 Plans: Fire the consultant since all regulatory issues will be resolved by then, let alone that the hardest sale (i.e., the first sale) will be done Hire one extra salesperson and another tech support person every year to increase sales Increase spending on travel, ad material, trade shows, and website maintenance Expected numbers of customers are 3 & 7 in years 2 & 3, respectively We will assume three time periods over only 3 years
Example: Associated Gas Energy COCA Calculation: Year 1 Year 1 Year 1 Year 1 Year 1 Year 1 Year 1 Year 1 Year 2 Year 2 Year 2 Year 2 Year 2 Year 2 Year 2 Year 2 Year 3 Year 3 Year 3 Year 3 Year 3 Year 3 Year 3 Year 3 Salespeople Salaries Salespeople Salaries Salespeople Salaries Salespeople Salaries Salespeople Salaries Salespeople Salaries Salespeople Salaries Salespeople Salaries $175K 1 = $175K $175K 1 = $175K $175K 1 = $175K $175K 1 = $175K $175K 1 = $175K $175K 1 = $175K $175K 1 = $175K $175K 1 = $175K $175K 2 = $350K $175K 2 = $350K $175K 2 = $350K $175K 2 = $350K $175K 2 = $350K $175K 2 = $350K $175K 2 = $350K $175K 2 = $350K $175K 3 = $525K $175K 3 = $525K $175K 3 = $525K $175K 3 = $525K $175K 3 = $525K $175K 3 = $525K $175K 3 = $525K $175K 3 = $525K Tech Support People Tech Support People Tech Support People Tech Support People Tech Support People Tech Support People Tech Support People Tech Support People Salaries Salaries Salaries Salaries Salaries Salaries Salaries Salaries $125 1 = $125K $125 1 = $125K $125 1 = $125K $125 1 = $125K $125 1 = $125K $125 1 = $125K $125 1 = $125K $125 1 = $125K $125 2 = $250K $125 2 = $250K $125 2 = $250K $125 2 = $250K $125 2 = $250K $125 2 = $250K $125 2 = $250K $125 2 = $250K $125 3 = $375K $125 3 = $375K $125 3 = $375K $125 3 = $375K $125 3 = $375K $125 3 = $375K $125 3 = $375K $125 3 = $375K Travel Travel Travel Travel Travel Travel Travel Travel $24,000 $24,000 $24,000 $24,000 $24,000 $24,000 $24,000 $24,000 $40,000 $40,000 $40,000 $40,000 $40,000 $40,000 $40,000 $40,000 $52,500 $52,500 $52,500 $52,500 $52,500 $52,500 $52,500 $52,500 Ad Material Ad Material Ad Material Ad Material Ad Material Ad Material Ad Material Ad Material $15,000 $15,000 $15,000 $15,000 $15,000 $15,000 $15,000 $15,000 $24,000 $24,000 $24,000 $24,000 $24,000 $24,000 $24,000 $24,000 $30,000 $30,000 $30,000 $30,000 $30,000 $30,000 $30,000 $30,000 Events Events Events Events Events Events Events Events $30,000 $30,000 $30,000 $30,000 $30,000 $30,000 $30,000 $30,000 $35,000 $35,000 $35,000 $35,000 $35,000 $35,000 $35,000 $35,000 $40,000 $40,000 $40,000 $40,000 $40,000 $40,000 $40,000 $40,000 Website Cost Website Cost Website Cost Website Cost Website Cost Website Cost Website Cost Website Cost $10,000 $10,000 $10,000 $10,000 $10,000 $10,000 $10,000 $10,000 $10,000 $10,000 $10,000 $10,000 $10,000 $10,000 $10,000 $10,000 $10,000 $10,000 $10,000 $10,000 $10,000 $10,000 $10,000 $10,000 Consultant Consultant Consultant Consultant Consultant Consultant Consultant Consultant $150,000 $150,000 $150,000 $150,000 $150,000 $150,000 $150,000 $150,000 $0 $0 $0 $0 $0 $0 $0 $0 $0 $0 $0 $0 $0 $0 $0 $0 TMSE TMSE TMSE TMSE TMSE TMSE TMSE TMSE TMSE(1) = $394,000 TMSE(1) = $394,000 TMSE(1) = $394,000 TMSE(1) = $394,000 TMSE(1) = $394,000 TMSE(1) = $394,000 TMSE(1) = $394,000 TMSE(1) = $394,000 TMSE(2) = $709,000 TMSE(2) = $709,000 TMSE(2) = $709,000 TMSE(2) = $709,000 TMSE(2) = $709,000 TMSE(2) = $709,000 TMSE(2) = $709,000 TMSE(2) = $709,000 TMSE(3) $1,032,500 TMSE(3) $1,032,500 TMSE(3) $1,032,500 TMSE(3) $1,032,500 TMSE(3) $1,032,500 TMSE(3) $1,032,500 TMSE(3) $1,032,500 TMSE(3) $1,032,500
Example: Associated Gas Energy COCA Calculation: Year 1 Year 1 Year 1 Year 1 Year 2 Year 2 Year 2 Year 2 Year 3 Year 3 Year 3 Year 3 TMSE TMSE TMSE TMSE TMSE(1) = $394,000 TMSE(1) = $394,000 TMSE(1) = $394,000 TMSE(1) = $394,000 TMSE(2) = $709,000 TMSE(2) = $709,000 TMSE(2) = $709,000 TMSE(2) = $709,000 TMSE(3) $1,032,500 TMSE(3) $1,032,500 TMSE(3) $1,032,500 TMSE(3) $1,032,500 NC NC NC NC NC(1) = 1 NC(1) = 1 NC(1) = 1 NC(1) = 1 NC(2) = 3 NC(2) = 3 NC(2) = 3 NC(2) = 3 NC(3) = 7 NC(3) = 7 NC(3) = 7 NC(3) = 7 IBSE IBSE IBSE IBSE IBSE(1) = $0 IBSE(1) = $0 IBSE(1) = $0 IBSE(1) = $0 IBSE(2) = $20,000 IBSE(2) = $20,000 IBSE(2) = $20,000 IBSE(2) = $20,000 IBSE(3) = $60,000 IBSE(3) = $60,000 IBSE(3) = $60,000 IBSE(3) = $60,000 COCA COCA COCA COCA COCA(1) = $394K COCA(1) = $394K COCA(1) = $394K COCA(1) = $394K COCA(2) = ($709K- $20K)/3 = $229.666K $20K)/3 = $229.666K $20K)/3 = $229.666K $20K)/3 = $229.666K COCA(2) = ($709K- COCA(2) = ($709K- COCA(2) = ($709K- COCA(3) = ($1,032,500- $60K)/7 = $138.928K $60K)/7 = $138.928K $60K)/7 = $138.928K $60K)/7 = $138.928K COCA(3) = ($1,032,500- COCA(3) = ($1,032,500- COCA(3) = ($1,032,500-
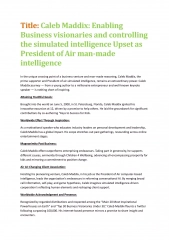
Example: Associated Gas Energy COCA TMSE IBSE NC 1200000 1000000 800000 600000 $ 400000 200000 0 Year 1 Year 2 Period Year 3
How To Reduce COCA? 1. While very powerful, use direct sales judiciously as it is very expensive Hiring a team to do direct sales may be necessary to start, but it is expensive Consider investing in technological enablers (e.g., telemarketing, effective web presence, social media, etc.,) Automate as much as possible via creating incentive schemes for your users to recruit others (e.g., Uber) Multi-Level Marketing (MLM), whereby a company makes revenue from non- salaried workforce (called participants), who sell its products and earn via a pyramid-shaped commission system is controversial (e.g., Avon) Participant Two revenue streams: 1) Commissions on their sales 2) Commission on their downline distributors' sales Recruited Downline Distributors Receive commission on ONLY their sales
How To Reduce COCA? 2. Improve conversion rate in sales Not every desired deal is closed, although (huge) cost is usually associated with every chased deal Increasing your rate of closing deals (e.g., improving your conversion rate) compensates for costs and opens up the funnel for more deals to get through One way to achieve this is to decrease the cost and enhance the quality of leads 3. Choose your business model with COCA in mind Your business model might make it easier to sell your product to customers; hence, decreasing the sales cycle length
How To Reduce COCA? 4. Drive positive word-of-mouth This can improve you company s stature and let you easily cross the chasm towards the mainstream market Focus on your beachhead market and employ the viral engine of growth (more on this next week) One way to measure results is to use the Net Promoter Score or NPS How likely is it that you would recommend a product to a friend or colleague? Respondents can be categorized into three groups: 1) Promoters (score 9-10) are loyal enthusiasts who will keep buying and refer others, fueling growth
How To Reduce COCA? 4. Drive positive word-of-mouth This can improve you company s stature and let you easily cross the chasm towards the mainstream market Focus on your beachhead market and employ the viral engine of growth (more on this next week) One way to measure results is to use the Net Promoter Score or NPS How likely is it that you would recommend a product to a friend or colleague? Respondents can be categorized into three groups: 2) Passives (score 7-8) are satisfied but unenthusiastic customers who are vulnerable to competitive offerings
How To Reduce COCA? 4. Drive positive word-of-mouth This can improve you company s stature and let you easily cross the chasm towards the mainstream market Focus on your beachhead market and employ the viral engine of growth (more on this next week) One way to measure results is to use the Net Promoter Score or NPS How likely is it that you would recommend a product to a friend or colleague? Respondents can be categorized into three groups: 3) Detractors (score 0-6) are unhappy customers who can damage your brand and impede growth through negative word-of-mouth NPS = % of Promoters - % of Detractors
Summary LTV and COCA allow you to determine whether the financials of your business will work They highlight the importance of keeping an eye on key factors to make your business profitable They provide simple scoreboard than the three core financial statements Recommendation: Do not let your optimism blind your from doing the right calculations of and using LTV and COCA
Next Financial Intelligence Part I
Why Financial Intelligence? Finance and accounting together make the language of business They allow you to answer basic questions, alongside controlling, evaluating, and planning operations What does my company own? How much does it owe others? How well did (or will) its operations go? How does it (or should) get the cash to fund itself? You need to be able to at least interpret core financial statements, which will enable you tocontrol, evaluate, and plan operations accordingly We will refer to this process as financial intelligence
Types of Accounting There are two types of accounting: 1. Accrual accounting It captures business activities irrespective of cash movement More precisely, transactions are recorded when activities are performed E.g., HP sold your startup a rack of servers in March 2019, but your startup will pay HP in February 2020 HP will record the sale (as accounts receivable), match it against its related cost, and compute the profit/loss in 2019, although it will receive the money from you in 2020 Your startup will record the sale (as accounts payable) and accrue (or allocate) the cost of the rack over its useful time
Types of Accounting There are two types of accounting: 2. Cash basis accounting It captures cash movement without regard to business activities More precisely, transactions are recorded only when cash changes hands Anytime you get cash from a customer, you call that revenue, even if the product or service is not delivered at that time Anytime you spend cash you call that expense E.g., If you pay a 2-year rent in 2019, all the rent cost will be recorded as an expense in 2019 and NOT over a period of 2 years
Example: Cash Basis Accounting Month 1: You offer a service to a customer where the cost to you is $100. The customer pays you $200 for your service. Month 1 Month 1 Month 1 Month 1 Month 1 Month 2 Month 2 Month 2 Month 2 Month 2 Month 3 Month 3 Month 3 Month 3 Month 3 Month 4 Month 4 Month 4 Month 4 Month 4 Revenue Revenue Revenue Revenue Revenue $200 $200 $200 $200 $200 Expenses Expenses Expenses Expenses Expenses $100 $100 $100 $100 $100 Profit Profit Profit Profit Profit 200-100= $100 200-100= $100 200-100= $100 200-100= $100 200-100= $100 Cash Cash Cash Cash Cash $100 $100 $100 $100 $100 This can be viewed as an oversimplified Income Statement (with no taxes, no debt, no interest, etc.), one of the three core financial statements
Example: Cash Basis Accounting Month 2: You offer a service to a customer where the cost to you is $200. You and the customer agree that they can pay you $400 next month. Month 1 Month 1 Month 1 Month 1 Month 1 Month 2 Month 2 Month 2 Month 2 Month 2 Month 3 Month 3 Month 3 Month 3 Month 3 Month 4 Month 4 Month 4 Month 4 Month 4 Revenue Revenue Revenue Revenue Revenue $200 $200 $200 $200 $200 $0 $0 $0 $0 $0 Expenses Expenses Expenses Expenses Expenses $100 $100 $100 $100 $100 $200 $200 $200 $200 $200 Profit Profit Profit Profit Profit 200-100= $100 200-100= $100 200-100= $100 200-100= $100 200-100= $100 -$200 -$200 -$200 -$200 -$200 Cash Cash Cash Cash Cash $100 $100 $100 $100 $100 100-200=$-100 100-200=$-100 100-200=$-100 100-200=$-100 100-200=$-100
Example: Cash Basis Accounting Month 3: You receive $400 from the customer you offered the service to last month. You receive $200 in advance from a customer that you have to offer a service to next month. Month 1 Month 1 Month 1 Month 1 Month 1 Month 2 Month 2 Month 2 Month 2 Month 2 Month 3 Month 3 Month 3 Month 3 Month 3 Month 4 Month 4 Month 4 Month 4 Month 4 Revenue Revenue Revenue Revenue Revenue $200 $200 $200 $200 $200 $0 $0 $0 $0 $0 400+200=$600 400+200=$600 400+200=$600 400+200=$600 400+200=$600 Expenses Expenses Expenses Expenses Expenses $100 $100 $100 $100 $100 $200 $200 $200 $200 $200 $0 $0 $0 $0 $0 Profit Profit Profit Profit Profit 200-100= $100 200-100= $100 200-100= $100 200-100= $100 200-100= $100 -$200 -$200 -$200 -$200 -$200 $600 $600 $600 $600 $600 Cash Cash Cash Cash Cash $100 $100 $100 $100 $100 100-200=$-100 100-200=$-100 100-200=$-100 100-200=$-100 100-200=$-100 -100+600=$500 -100+600=$500 -100+600=$500 -100+600=$500 -100+600=$500
Example: Cash Basis Accounting Month 4: You offer your service to the customer who paid you last month. The service costed you $100. Month 1 Month 1 Month 1 Month 1 Month 1 Month 2 Month 2 Month 2 Month 2 Month 2 Month 3 Month 3 Month 3 Month 3 Month 3 Month 4 Month 4 Month 4 Month 4 Month 4 Revenue Revenue Revenue Revenue Revenue $200 $200 $200 $200 $200 $0 $0 $0 $0 $0 400+200=$600 400+200=$600 400+200=$600 400+200=$600 400+200=$600 $0 $0 $0 $0 $0 Expenses Expenses Expenses Expenses Expenses $100 $100 $100 $100 $100 $200 $200 $200 $200 $200 $0 $0 $0 $0 $0 $100 $100 $100 $100 $100 Profit Profit Profit Profit Profit 200-100= $100 200-100= $100 200-100= $100 200-100= $100 200-100= $100 -$200 -$200 -$200 -$200 -$200 $600 $600 $600 $600 $600 $-100 $-100 $-100 $-100 $-100 Cash Cash Cash Cash Cash $100 $100 $100 $100 $100 100-200=$-100 100-200=$-100 100-200=$-100 100-200=$-100 100-200=$-100 -100+600=$500 -100+600=$500 -100+600=$500 -100+600=$500 -100+600=$500 500-100=$400 500-100=$400 500-100=$400 500-100=$400 500-100=$400 Non-Profitable Profitable Profitable Non-Profitable The business is steadier than what the above seems to imply!
Example: Accrual Accounting Month 1: Month 1 Month 2 Month 3 Month 4 Revenue $200 Expenses $100 Profit 200 100 = $100 Cash $100 Accounts Receivable $0 Deferred Revenue $0 A money that you will receive in the future for a service/product that you have already delivered.
Example: Accrual Accounting Month 1: Month 1 Month 2 Month 3 Month 4 Revenue $200 Expenses $100 Profit 200 100 = $100 Cash $100 Accounts Receivable $0 Deferred Revenue $0 A money that you have received in advance for a service/product that you will deliver in the future.
Example: Accrual Accounting Month 1: You offer a service to a customer where the cost to you is $100. The customer pays you $200 for your service. Month 1 Month 1 Month 1 Month 1 Month 1 Month 1 Month 2 Month 2 Month 2 Month 2 Month 2 Month 2 Month 3 Month 3 Month 3 Month 3 Month 3 Month 3 Month 4 Month 4 Month 4 Month 4 Month 4 Month 4 Revenue Revenue Revenue Revenue Revenue Revenue $200 $200 $200 $200 $200 $200 Expenses Expenses Expenses Expenses Expenses Expenses $100 $100 $100 $100 $100 $100 Profit Profit Profit Profit Profit Profit 200 100 = $100 200 100 = $100 200 100 = $100 200-100 = $100 200-100 = $100 200-100 = $100 Cash Cash Cash Cash Cash Cash $100 $100 $100 $100 $100 $100 Accounts Receivable Receivable Receivable Receivable Receivable Receivable Accounts Accounts Accounts Accounts Accounts $0 $0 $0 $0 $0 $0 Deferred Revenue Deferred Revenue Deferred Revenue Deferred Revenue Deferred Revenue Deferred Revenue $0 $0 $0 $0 $0 $0
Example: Accrual Accounting Month 2: You offer a service to a customer where the cost to you is $200. You and the customer agree that they can pay you $400 next month. Even though the customer did not pay you! Month 1 Month 1 Month 1 Month 1 Month 2 Month 2 Month 2 Month 2 Month 3 Month 3 Month 3 Month 3 Month 4 Month 4 Month 4 Month 4 Revenue Revenue Revenue Revenue $200 $200 $200 $200 $400 $400 $400 $400 Expenses Expenses Expenses Expenses $100 $100 $100 $100 $200 $200 $200 $200 Profit Profit Profit Profit 200-100 = $100 200-100 = $100 200-100 = $100 200-100 = $100 400-200 = $200 400-200 = $200 400-200 = $200 400-200 = $200 Cash Cash Cash Cash $100 $100 $100 $100 -200+100 = $-100 -200+100 = $-100 -200+100 = $-100 -200+100 = $-100 Accounts Receivable Receivable Receivable Receivable Accounts Accounts Accounts $0 $0 $0 $0 $400 $400 $400 $400 Deferred Revenue Deferred Revenue Deferred Revenue Deferred Revenue $0 $0 $0 $0 $0 $0 $0 $0
Example: Accrual Accounting Month 2: You offer a service to a customer where the cost to you is $200. You and the customer agree that they can pay you $400 next month. Month 1 Month 1 Month 1 Month 1 Month 1 Month 1 Month 2 Month 2 Month 2 Month 2 Month 2 Month 2 Month 3 Month 3 Month 3 Month 3 Month 3 Month 3 Month 4 Month 4 Month 4 Month 4 Month 4 Month 4 Revenue Revenue Revenue Revenue Revenue Revenue $200 $200 $200 $200 $200 $200 $400 $400 $400 $400 $400 $400 Expenses Expenses Expenses Expenses Expenses Expenses $100 $100 $100 $100 $100 $100 $200 $200 $200 $200 $200 $200 Profit Profit Profit Profit Profit Profit 200-100 = $100 200-100 = $100 200-100 = $100 200-100 = $100 200-100 = $100 200-100 = $100 400-200 = $200 400-200 = $200 400-200 = $200 400-200 = $200 400-200 = $200 400-200 = $200 Cash Cash Cash Cash Cash Cash $100 $100 $100 $100 $100 $100 -200+100 = $-100 -200+100 = $-100 -200+100 = $-100 -200+100 = $-100 -200+100 = $-100 100-200 = $-100 Accounts Receivable Receivable Receivable Receivable Receivable Receivable Accounts Accounts Accounts Accounts Accounts $0 $0 $0 $0 $0 $0 $400 $400 $400 $400 $400 $400 Deferred Revenue Deferred Revenue Deferred Revenue Deferred Revenue Deferred Revenue Deferred Revenue $0 $0 $0 $0 $0 $0 $0 $0 $0 $0 $0 $0
Example: Accrual Accounting Month 2: You offer a service to a customer where the cost to you is $200. You and the customer agree that they can pay you $400 next month. Month 1 Month 1 Month 1 Month 1 Month 1 Month 1 Month 2 Month 2 Month 2 Month 2 Month 2 Month 2 Month 3 Month 3 Month 3 Month 3 Month 3 Month 3 Month 4 Month 4 Month 4 Month 4 Month 4 Month 4 Revenue Revenue Revenue Revenue Revenue Revenue $200 $200 $200 $200 $200 $200 $400 $400 $400 $400 $400 $400 Expenses Expenses Expenses Expenses Expenses Expenses $100 $100 $100 $100 $100 $100 $200 $200 $200 $200 $200 $200 Profit Profit Profit Profit Profit Profit 200-100 = $100 200-100 = $100 200-100 = $100 200-100 = $100 200-100 = $100 200-100 = $100 400-200 = $200 400-200 = $200 400-200 = $200 400-200 = $200 400-200 = $200 400-200 = $200 Cash Cash Cash Cash Cash Cash $100 $100 $100 $100 $100 $100 -200+100 = $-100 -200+100 = $-100 -200+100 = $-100 -200+100 = $-100 -200+100 = $-100 100-200 = $-100 Accounts Receivable Receivable Receivable Receivable Receivable Receivable Accounts Accounts Accounts Accounts Accounts $0 $0 $0 $0 $0 $0 $400 $400 $400 $400 $400 $400 Deferred Revenue Deferred Revenue Deferred Revenue Deferred Revenue Deferred Revenue Deferred Revenue $0 $0 $0 $0 $0 $0 $0 $0 $0 $0 $0 $0
Example: Accrual Accounting Month 3: You receive $400 from the customer you offered the service to last month. You receive $200 in advance from a customer that you have to offer a service to next month. Month 1 Month 1 Month 1 Month 1 Month 2 Month 2 Month 2 Month 2 Month 3 Month 3 Month 3 Month 3 Month 4 Month 4 Month 4 Month 4 Revenue Revenue Revenue Revenue $200 $200 $200 $200 $400 $400 $400 $400 $0 $0 $0 $0 Expenses Expenses Expenses Expenses $100 $100 $100 $100 $200 $200 $200 $200 $0 $0 $0 $0 Profit Profit Profit Profit 200-100 = $100 200-100 = $100 200-100 = $100 200-100 = $100 400-200 = $200 400-200 = $200 400-200 = $200 400-200 = $200 $0 $0 $0 $0 Cash Cash Cash Cash $100 $100 $100 $100 100-200 = $-100 100-200 = $-100 100-200 = $-100 100-200 = $-100 -100+400+200= $500 -100+400+200= $500 -100+400+200= $500 -100+400+200= $500 Accounts Receivable Receivable Receivable Receivable Accounts Accounts Accounts $0 $0 $0 $0 $400 $400 $400 $400 $0 $0 $0 $0 Deferred Revenue Deferred Revenue Deferred Revenue Deferred Revenue $0 $0 $0 $0 $0 $0 $0 $0 $200 $200 $200 $200 This is more of a liability; hence, not recorded as a revenue.
Example: Accrual Accounting Month 4: You offer your service to the customer who paid you last month. Month 1 Month 1 Month 2 Month 2 Month 3 Month 3 Month 4 Month 4 Revenue Revenue $200 $200 $400 $400 $0 $0 $200 $200 Expenses Expenses $100 $100 $200 $200 $0 $0 $100 $100 Profit Profit 200-100 = $100 200-100 = $100 400-200 = $200 400-200 = $200 $0 $0 $100 $100 Cash Cash $100 $100 100-200 = $-100 100-200 = $-100 -100+400+200= $500 -100+400+200= $500 500-100=$400 500-100=$400 Accounts Receivable Receivable Accounts $0 $0 $400 $400 $0 $0 $0 $0 Deferred Revenue Deferred Revenue $0 $0 $0 $0 $200 $200 $0 $0
Example: Accrual Accounting Month 4: You offer your service to the customer who paid you last month. The service costed you $100. Month 1 Month 1 Month 1 Month 1 Month 1 Month 1 Month 2 Month 2 Month 2 Month 2 Month 2 Month 2 Month 3 Month 3 Month 3 Month 3 Month 3 Month 3 Month 4 Month 4 Month 4 Month 4 Month 4 Month 4 Revenue Revenue Revenue Revenue Revenue Revenue $200 $200 $200 $200 $200 $200 $400 $400 $400 $400 $400 $400 $0 $0 $0 $0 $0 $0 $200 $200 $200 $200 $200 $200 Expenses Expenses Expenses Expenses Expenses Expenses $100 $100 $100 $100 $100 $100 $200 $200 $200 $200 $200 $200 $0 $0 $0 $0 $0 $0 $100 $100 $100 $100 $100 $100 Profit Profit Profit Profit Profit Profit 200-100 = $100 200-100 = $100 200-100 = $100 200-100 = $100 200-100 = $100 200-100 = $100 400-200 = $200 400-200 = $200 400-200 = $200 400-200 = $200 400-200 = $200 400-200 = $200 $0 $0 $0 $0 $0 $0 $100 $100 $100 $100 $100 $100 Cash Cash Cash Cash Cash Cash $100 $100 $100 $100 $100 $100 100-200 = $-100 100-200 = $-100 100-200 = $-100 100-200 = $-100 100-200 = $-100 100-200 = $-100 -100+400+200= $500 -100+400+200= $500 -100+400+200= $500 -100+400+200= $500 -100+400+200= $500 -100+400+200= $500 500-100=$400 500-100=$400 500-100=$400 500-100=$400 500-100=$400 500-100=$400 Accounts Receivable Receivable Receivable Receivable Receivable Receivable Accounts Accounts Accounts Accounts Accounts $0 $0 $0 $0 $0 $0 $400 $400 $400 $400 $400 $400 $0 $0 $0 $0 $0 $0 $0 $0 $0 $0 $0 $0 Deferred Revenue Deferred Revenue Deferred Revenue Deferred Revenue Deferred Revenue Deferred Revenue $0 $0 $0 $0 $0 $0 $0 $0 $0 $0 $0 $0 $200 $200 $200 $200 $200 $200 $0 $0 $0 $0 $0 $0 The profits reflect better the activities of the business!
The Balance Sheet The balance sheet presents: The assets owned by your company The liabilities owed to others And the accumulated investment of the owners (i.e., owner s equity) Assets are the resources that the company posses for future benefits Examples: Cash Inventory Accounts receivable Equipment Buildings
The Balance Sheet Liabilities are dollar-specific obligations to pay or repay, and other obligations to provide products or services to others Examples: Bank debt Accounts payable (i.e., amount owed to suppliers) Prepaid accounts or deferred revenues (i.e., advances from customers to deliver products or services) Taxes owed (or taxes payable) Wages owed to employees (or wages payable)
The Balance Sheet Owner s equity is the accumulated dollar measure of the investments made by the owners in the company Examples (more on these later) Common stock Paid-in-capital (i.e., the funds raised by the company from equity and not from ongoing operations) Retained earnings (i.e., reinvestment of earnings) As its name implies, the balance sheet is a balance sheet, where: Assets (A) = Liabilities (L) + Owner s Equity (OE)
Very Simple Example Balance Sheet- End of Month 2 Balance Sheet- End of Month 1 A A DR = 0 DR = 0 L L Income statement of month 2 on an accrual basis Cash: -$100 AR: $400 Cash: $100 AR: $0 Equity: $300 Equity: $100 OE OE Month 1 Month 2 Month 3 Month 4 Revenue $200 $400 $0 $200 Expenses $100 $200 $0 $100 Profit 200-100 = $100 400-200 = $200 $0 $100 Cash $100 100-200 = $-100 -100+400+200= $500 500-100=$400 Accounts Receivable (AR) $0 $400 $0 $0 Deferred Revenue (DR) $0 $0 $200 $0
Very Simple Example Balance Sheet- End of Month 2 Balance Sheet- End of Month 1 A A DR = 0 DR = 0 L L Income statement of month 2 on an accrual basis Cash: -$100 AR: $400 Cash: $100 AR: $0 Equity: $300 Equity: $100 OE OE Month 1 Month 2 Month 3 Month 4 Revenue $200 $400 $0 $200 Expenses $100 $200 $0 $100 Profit 200-100 = $100 400-200 = $200 $0 $100 Cash $100 100-200 = $-100 -100+400+200= $500 500-100=$400 The balance sheet is a snapshot of a company s holdings at a given time, Accounts Receivable (AR) while the income statement shows the flow of activities and transactions over a specific period of time. $0 $400 $0 $0 Deferred Revenue (DR) $0 $0 $200 $0
Next Class Financial Intelligence- Part II