Calibration as the Best Weighting Method: Exploring European Social Survey Data
Calibration is a crucial weighting adjustment method that leverages auxiliary variables to improve survey estimates. Seppo Laaksonen from the University of Helsinki highlights the importance of utilizing all available auxiliary variables for effective calibration. This method, illustrated using examples from the European Social Survey, ensures more accurate survey results. The process involves calculating gross and net sample design weights, analyzing response rates, and estimating parameters like happiness mean. Despite minor variations, refined calibration leads to improved results with minimal impact on estimates. Explore the advantages and considerations of calibration in survey methodology.

Download Presentation

Please find below an Image/Link to download the presentation.
The content on the website is provided AS IS for your information and personal use only. It may not be sold, licensed, or shared on other websites without obtaining consent from the author.If you encounter any issues during the download, it is possible that the publisher has removed the file from their server.
You are allowed to download the files provided on this website for personal or commercial use, subject to the condition that they are used lawfully. All files are the property of their respective owners.
The content on the website is provided AS IS for your information and personal use only. It may not be sold, licensed, or shared on other websites without obtaining consent from the author.
E N D
Presentation Transcript
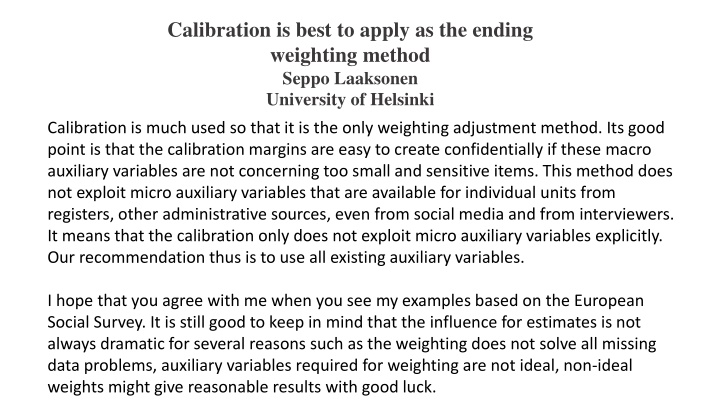
Calibration is best to apply as the ending weighting method Seppo Laaksonen University of Helsinki Calibration is much used so that it is the only weighting adjustment method. Its good point is that the calibration margins are easy to create confidentially if these macro auxiliary variables are not concerning too small and sensitive items. This method does not exploit micro auxiliary variables that are available for individual units from registers, other administrative sources, even from social media and from interviewers. It means that the calibration only does not exploit micro auxiliary variables explicitly. Our recommendation thus is to use all existing auxiliary variables. I hope that you agree with me when you see my examples based on the European Social Survey. It is still good to keep in mind that the influence for estimates is not always dramatic for several reasons such as the weighting does not solve all missing data problems, auxiliary variables required for weighting are not ideal, non-ideal weights might give reasonable results with good luck.
Summary from the Springer book Laaksonen, Seppo (2018). Survey Methodology and Missing Data. Tools and Techniques for Practitioners. Springer
First Example with some auxiliary variables This is from the Finnish ESS data in Round 7. As everyone knows Finland, Sweden, Denmark, Estonia, Norway etc. have access to several registers and administrative data but any of these countries have not provided best possible auxiliary data for the ESS. One reason is that the ESS has not really required to include such data and secondly, the persons responsible are too lazy. Hopefully, this will be improving in future. Finland s micro auxiliary variables are as follows: Urbanicity (3 categories) Gender*Age group (2*13=26) Marital status (4) Language (3) Region (6) We see that anything about education, income, employment status, among others, is not there; they often are better auxiliary variables than those above.
The scheme above means to first calculate the gross sample design weights w_gross that are for the ESS Finland simplest possible since the they are the inverses of the inclusion probabilities that are equal. The second weights take into account the response rates. The ESS makes these too simply since their response rates are equal = 62.9%. I did not like to use as simple weights and hence I created 8 explicit strata using the implicit strata of the sampling design file. These are used in sample selection based on equidistance (systematic) sampling. Now the minimum response rate is 57.0% and the maximum 69.3% respectively. It leads to the net sample design weights w_resp. The following simple SAS table shows the characteristics of both weights.
The net sample basic weights are the simplest weights. I estimated several parameters using these weights but I present one only, that is, the mean of happiness. It is 8.046. The mean of the ESS design weight 8.043 is rather close to that. The best ESS weights (based on post-stratification) give a bit smaller happiness = 8.038. We see that a better weight leads to a smaller happiness but very little. We however continue for creating the calibrated weights after the basic weight. This gives the happiness mean = 8.030 that is even smaller. The calibration margins here and later are: Stratum (9 subgroups) Gender (2) Education (8 from the newest statistics, one is a missing category since everyone did not tell education) Age group (7 ) Region (6)
I thus do not recommend the calibration method only for sample data weighting but hope that it will be used in the end for really calibrating using best possible calibration margins in order to improve confidence in survey estimates. For example, if the gender shares are far from the truth, it is hard to trust in any estimates. The calibration does not mean that all the estimates will be good. What to do before calibration? - Proper post-stratification is always good to apply if the correct post-strata (calibration margins) are available - Response propensity weights are good to create after post-stratification or starting from the basic weights. In this example, we had not good micro auxiliary variables well available but I did my best - For estimating probit regression (logit is possible too) trying to take advantage of all 5 variables using also several interactions. The success was not excellent but the happiness declined to 8.024. This is the smallest without calibration. I got even a smaller estimate after the calibrating this probit based weight = 8.000. It is good to keep in mind that a smallest happiness in general is the best estimate. After many attempts I succeeded to some extent but if we had better micro auxiliary variables such as education with many categories, the results would be better.
Second Example with micro and macro auxiliary variables This is created from the ESS data files of Round 6 so that it is confidential. Initial files are not confidential but I hade access in those: Hence I created a very good sampling design data file, better than in any country. The most important variable is education with 6 categories (no missing categories). The full list of SDDF variables is here:
The sampling of this file is a two domain, that is, urban areas are following simple random (SRS) approach whereas I applied two-stage cluster sampling in rural areas. This is an inexpensive strategy in face-to-face surveys. In addition, there are explicit strata in both domains (2 in cluster domain, 6 in SRS). Primary sampling unit (PSU) is an individual in the SRS domain whereas a real cluster in the cluster. This two- domain strategy is becoming more common in the ESS countries.
There are various opportunities to adjust weights, starting from the basic weights. As said earlier, I use response propensity weights first, and then calibrate these to correspond to the important known margins. A rather good first method is response homogeneity group (RHG) weighting which example is here. I exploit the SAS procedure HPSPLIT with the explanatory variables Education, Income, Gender (1=male), Marriage (2=married) and 15 years and older members. I got 7 RHG s. This auxiliary variable is called Macro2_RHG. The minimum response rate 0.28 is in Node 7 whereas the maximum 0.77 in Node B. 0.51 RR = 0.28 0.69 0.39 0.49 0.77 0.65
In my weighting adjustments, different types of auxiliary variables are tested, both macro (aggregate) and/or micro. The micro variables thus are for each individual. The macro ones can be formed in various ways. RHG s at the previous page are without any specific variables even though have been exploiting various micro variables. RHG s are easy to make confidential as in my example. These are also called Macro2 or Macro2_RHG. All macro variables can be made confidential: - I call Macro1 those used as calibration margins. - In addition I made two other macro s, called Macro3A and Macro3B. A (16) is based on the two first stage aggregates (gender and stratum) whereas B (60) on all the three first stage aggregates (age group as well); this is for testing how different are the results. Within these aggregates, several other variables either as the means or the coefficients of variation have been computed. The next page gives some examples for education means and income means.
In my weighting adjustments, different types of auxiliary variables are tested, both macro (aggregate) and micro. The following list covers 20 randomly selected observations; variables focusing on education and income.
I thus continue building the response propensity model with a probit link using four types of auxiliary variables, Macro2, Macro3A, Macro3B and Micro and later calibrate using these my Macro1 variables. As observed Macro3 does not well fit with the respective micro Education or Income but is better than a random selection. To illustrate the response probabilities or propensities that have a big role in these respective weights, I present an example on next page based on micro auxiliary variables. It illustrates the variation on these propensities in some domains, but we see that the highest are for Education 5, lowest for Education 2. Most highly educated (Education 7) are not best respondents. Next I present some basic results beginning from Pure calibration but ending the method that takes advantage of both micro auxiliary variables and best calibration margins. These margins are selected from the findings of Pure calibration ; see the table two pages forward.
Cumulative response propensities for some domains based on the best Probit model of micro auxiliary variables
Happiness using the basic weights and their calibration with five different calibration margins. (CV = Coefficient of variation)
Adjusted weights and happiness results based on the two response propensity (RP) macro 3 weights and continued to calibration
Weights and happiness estimates using response homogeneity groups based on the RP model and calibration. plus that macro3B is included.
The auxiliary variables of our micro model and their significance in the response propensity probit model (* means the interaction)
Results by response propensity weighting and calibration based on micro auxiliary variables. Using the previous page model.
Happiness averages in different methods. Pure Basic or RP method is without calibration, either using basic weights or RP weights, Pure calibrated is based on four best calibration margins after the Pure Basic or RP method Best are response propensity weights with micro s plus calibration. But unless micro s available, start with RHG s so that these are really homogeneous SUMMARY IN GRAPHS
To repeat and continue: Best are response propensity weights with micro auxiliary variables plus calibration. But unless micro s available, start with RHG s so that these are really homogeneous. A good point is that Calibration helps always but not substantially. It gives opportunity to calibrate some important margins hopefully to correct ones. But if these margins are not based on more or less true values (e.g. based on a sample), it might be problematic. I want to remind also that too many calibration categories might also be problematic. I used raking-ratio calibration based on INSEE Calmar 2 that does lead to negative weights as linear calibration often does. In these examples, negative weights are not common but observed in 10-15% cases.