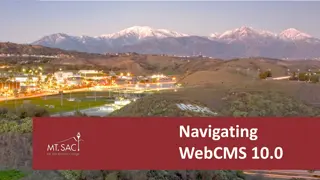
California School Dashboard Update for LD South Title 1 Designees Meeting
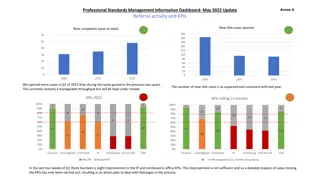
Strengthen foundational knowledge about the California School Dashboard by providing state indicators overview, status and change tables, and preparation for planning and monitoring progress. The Dashboard showcases publicly available school and district level data, with updates for Fall 2017 and insights into identification criteria for Fall 2018. Explore suspension rates, EL progress, and more.

Download Presentation

Please find below an Image/Link to download the presentation.
The content on the website is provided AS IS for your information and personal use only. It may not be sold, licensed, or shared on other websites without obtaining consent from the author.If you encounter any issues during the download, it is possible that the publisher has removed the file from their server.
You are allowed to download the files provided on this website for personal or commercial use, subject to the condition that they are used lawfully. All files are the property of their respective owners.
The content on the website is provided AS IS for your information and personal use only. It may not be sold, licensed, or shared on other websites without obtaining consent from the author.
E N D
Presentation Transcript
California Dashboard Update Adapted For LD South Title 1 Designees Meeting, December 6, 2017 Produced by the Offices of: Student Testing, Data and Accountability, and FSEP
Objectives Strengthen foundational knowledge about the California School Dashboard by: Providing a brief overview of state indicators Reviewing Status and Change tables to demonstrate how Performance Levels are determined Prepare school leaders for planning/monitoring progress toward the Dashboard by: Sharing an update on the data that will be reflected in the Fall 2017 Dashboard Update and what we know/do not know about identification criteria for Fall 2018
California School Dashboard School and district level data are publicly available across multiple indicators The Dashboard will be updated in the end of November 2017 (no stakes) The Fall 2018 Dashboard update will include accountability (schools will be identified for intervention) ****Go to www.caschooldashboard.org**** 3
State Indicators (for Schools and LEAs) State Indicator Chronic Absenteeism Suspension Rate EL Progress Levels Additional Information K-8 While methodology is not finalized, students will be considered chronically absent if attendance is 90% or below. Includes in-school and out-of-school suspensions (single student) Includes annual progress on CELDT, Reclassified ELs prior year, extra credit for LTELs who increased 1 level on CELDT (the State will update this indicator based on ELPAC in future years) Student scores on SBA based on average distance from the minimum proficiency score ( Level 3 ); CAA for info only 2017. Student scores on SBA based on average distance from the minimum proficiency score ( Level 3 ). CAA for info only 2017. Four-year cohort graduation rate (possibility of including 5-yr. rate in future years) For the 4 yr. cohort: 11th grade SBA scores, AP & IB tests, A-G completion with C or above, dual enrollment, career pathway completion with C or above K-12 K-12 Academic- ELA 3-8 Academic- Math 3-8 Graduation Rate 9-12 College/Career 9-12
Suspension Rate: Calculation Formula Status: Based on the unduplicated number of students suspended within the 2016 17 school year. Number of Students Suspended divided by Cumulative Enrollment Multiplied by 100 Change: 2016-17 suspension rate minus 2015-16 suspension rate California Department of Education 5
EL Progress Formula (Fall 2017) Status: Annual CELDT Takers Who Increased at least 1 CELDT Level Plus Annual CELDT Test Takers Who Maintained English Proficiency in the Early Advanced/Advanced CELDT Levels Plus ELs Who Were Reclassified in the Prior Year Plus LTEL CELDT Takers Who Increased at Least 1 Level (new criteria) Divided by Total Number of Annual CELDT Test Takers in the Current Year plus ELs Who Were Reclassified in the Prior Year Change: current year status minus prior year status
Academic Indicators Formula Status: Sum of All Grades 3 through 8 Students Distance from Level 3 on the 2016 Smarter Balanced Summative Assessments divided by Total Number of 2016 Grades 3 through 8 Smarter Balanced Summative Assessments Test Takers Change: current year status minus prior year status 7
Academic Indicator Distance from Level 3 Example Subgroup A Subgroup B 2700 2600 +193 +152 +148 +118 2500 +69 +68 +58 Level 3 (2432) 2400 +18 -28 2300 -101 -152 2200 -210 2100 For ELA 3rd Grade, Level 3 equals a scale score of 2432 Each student s distance from Level 3 is averaged Overall (+27.75) Subgroup A (+54.75) 8
College & Career Formula Status: note that students who take the California Alternate Assessment (CAA) are not included in the CCI and are removed from the calculations. Class of 2016 Graduates Who Meet the Prepared Benchmark divided by Class of 2016 Graduation Cohort minus Students Who Take the CAAs Change will not be reported in Fall 2017 Update 9
Options & Special Education Centers The Fall 2017 Dashboard update will not report data or performance levels for options schools that are on the Dashboard Alternative School Status (DASS) list (available here: http://www.cde.ca.gov/ta/ac/activeschools.asp) The State is developing an alternative accountability system for DASS schools, based on the same set of indicators that will be applied to other schools. The indicators may be calculated differently: E.g., graduation rate may be a 1 year graduation rate The State will identify DASS schools beginning in Fall 2018
Turn and Talk Turn to an elbow partner- what questions do you have so far about what has been said today? Q & A
Reviewing the Dashboard: Performance Levels Performance Levels
Performance Levels for State Indicators Performance Levels are calculated using percentiles that combine Status and Change using a five-by- five colored table that produced 25 results represented by five colors. Blue Green Yellow Orange Red Highest Lowest
Performance Levels: Based on Status and Change 2016 EL Indicator: 71.4% 2015 EL Indicator: 73.9% Difference between 2016 and 2015: -2.5
What data will be reflected? Anticipated data for Fall 2017 Update Anticipated data for Fall 2018 Update Chronic Absence (Status Only) Chronic Absence (Performance Level) Based on 2017-18 compared to 2016-17 Based on 2016-17 Suspension Rate (Performance Level) Based on 2016-17 compared to 2015-16 Suspension Rate (Performance Level) Based on 2017-18 compared to 2016-17 EL Progress (Performance Level- CELDT) Based on 2016-17 compared to 2015-16 EL Progress (Status Only- ELPAC) Based on 2017-18 ELA & Math 3rd-8th (Performance Levels) Based on 2016-17 compared to 2015-16 ELA & Math 3rd-8th (Performance Levels) Based on 2017-18 compared to 2016-17; may use growth model to determine change Graduation Rate (Performance Level) Based on 2015-16 compared to 3-year weighted average of 2013 through 2015 Graduation Rate (Performance Level) Based on 2016-17 compared to 3-year weighted average of 2014 through 2016; may include 5 yr. rate College and Career (Status Only) College and Career (Performance Level) Based on 2017-18 compared to 2016-17 Based on 2015-16 High School Readiness (Status Only) No information yet
What do we know about identification criteria for Fall 2018? Per ESSA, the State is required to identify the lowest performing 5% of schools (Comprehensive Support and Improvement) and apply the same criteria to each subgroup to identify schools for achievement gaps (Targeted Support and Improvement). Any school that has all red performance levels across it s indicators OR all red + 1 orange will be identified Any school with graduation below 67% for each of the most recent 3 years will be identified Butthat doesn t get the State to the minimum 5% of schools for Comprehensive Support and Improvement, so they will adopt additional criteria in January 2018.
Key Idea This year counts! We may not have a full set of criteria for school identifications; however, we know the following: Schools will be identified in Fall 2018 Any high school with fewer than 67% of students graduating each of the last three years will be identified Any Title I school where all students, or any subgroup, perform across indicators as all red, or all red and one orange will be identified In January, the State will determine additional identification criteria so as to meet minimum Federal requirements
Indicator Differences: CDE vs. LAUSD Indicator Chronic Absenteeism Suspension Rate What s Different? CDE 90% or below. LAUSD 91% or below. (1) CDE includes in & out-of-school suspensions. MyData reports all 3 types. LCAP only reports out-of-school. (2) The CDE s denominator is cumulative enrollment for the school year. MyData & other reports use a snapshot. Counts students who reclassify during the school year (July June), whereas the traditional reclassification rate counts students who reclassify from October-October. (1) The CDE s grad rate includes dropouts,but LAUSD s grad progress reports only include currently enrolled students. (2) The CDE s grad year may not match district s. CCI measures achievement of a grad cohort across a variety of metrics, whereas most district college-career reporting is limited to annual time slices. New indicator looks at distance from level 3, but on LCAP & elsewhere District reports % meeting/exceeding stds. English Learner Progress Graduation Rate College & Career Indicator Academic Indicator 22
Suggested Next Steps Review your Fall 2017 Dashboard and identify areas in need of improvement: Is your school red or orange on any of the indicators for all students or any subgroups? Does your current school plan address those areas, or might you want to modify your plan mid-year? Use the Certify tool Ensure your data are accurately reported to the State Focus on Academic Achievement for all students Each student s improvement counts toward the school s result
Resources LAUSD Accountability Webpage: achieve.lausd.net/accountability LAUSD Principal s Toolkit (Access via LAUSD accountability page under staff resources available by mid-November ) California Department of Education Resources www.caschooldashboard.org/#/resources LAUSD Accountability Staff Resources lausd.sharepoint.com/sites/oda/accountability Reference Guide 6885, Certify Policy/Procedures MiSiS Help Desk (213) 241-5200 State Reporting Services Branch Phone: (213) 241-2450 Fax: (213) 241-8969 24


")

")


")