California Travel Data Analysis for COVID-19 Recovery Trends
Explore the latest data on travel demand recovery in California post-COVID-19. Analyzing driving trips, telework trends, transit ridership, and losses to inform scenario design and fuel demand forecasts.

Download Presentation

Please find below an Image/Link to download the presentation.
The content on the website is provided AS IS for your information and personal use only. It may not be sold, licensed, or shared on other websites without obtaining consent from the author. If you encounter any issues during the download, it is possible that the publisher has removed the file from their server.
You are allowed to download the files provided on this website for personal or commercial use, subject to the condition that they are used lawfully. All files are the property of their respective owners.
The content on the website is provided AS IS for your information and personal use only. It may not be sold, licensed, or shared on other websites without obtaining consent from the author.
E N D
Presentation Transcript
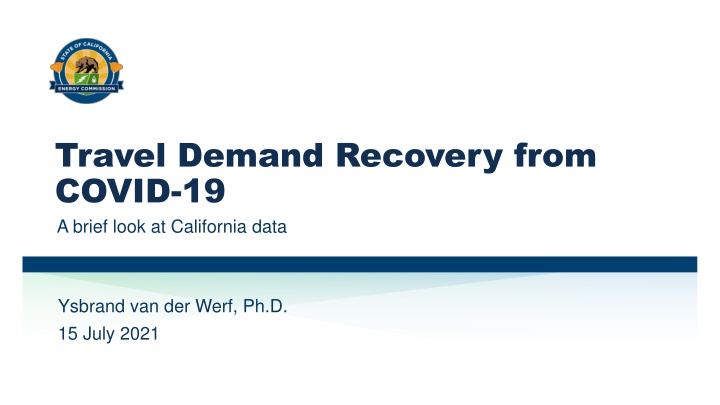
Travel Demand Recovery from COVID-19 A brief look at California data Ysbrand van der Werf, Ph.D. 15 July 2021
Introduction Look at some measures of travel under COVID conditions This will be used in scenario design for our transportation fuel demand forecast Synthetic data, survey data, bridge tolls, transit fares, fuel sales Compare the sources Compare with scenarios developed last year for COVID VMT 2
Number of Drivers and Teleworkers(?) California Driving during COVID, Seven-day moving averages (Trips per Person per Day) California Teleworkers, 2020-2021 14,000,000 12,000,000 0.90 4.50 0.80 4.00 10,000,000 0.70 3.50 0.60 3.00 8,000,000 0.50 2.50 6,000,000 0.40 2.00 0.30 1.50 4,000,000 0.20 1.00 0.10 0.50 2,000,000 0.00 0.00 Oct-20 Apr-20 Apr-21 Jul-20 Nov-20 Dec-20 May-20 Aug-20 Sep-20 Jan-20 Mar-20 Jun-20 Jan-21 Mar-21 Feb-20 Feb-21 0 Work trips/person/day, 7 day MA Non-work trips/person/day, 7 day MA (RH axis) all telework COVID telework Source: University of Maryland Covid-19 Impact Analysis Platform Source: U.S. Census Bureau, Household Pulse Survey 3
Recovery of Driving Trips(?) Percent Recovery from Maximum Reduction in Trips per Person Percent Recovery of California Teleworkers, 2020-2021 2.5 100% 90% 2 80% 70% 1.5 60% 50% 1 40% 33% 53% 30% 0.5 20% 10% 0 1-Jul-20 1-Nov-20 1-Dec-20 1-May-20 1-Aug-20 1-Sep-20 1-Jan-20 1-Jun-20 1-Jan-21 1-Mar-20 1-Mar-21 1-Oct-20 1-Feb-20 1-Feb-21 1-Apr-20 1-Apr-21 0% Percent recovery from Max Telework Percent recovery from Max Non-work Trips % Recovery from Max Telework Source: U.S. Census Bureau, Household Pulse Survey Source: University of Maryland Covid-19 Impact Analysis Platform 4
Transit Ridership: Two examples BART Daily Ridership, 7 day MA LA Metro Monthly Systemwide Ridership Estimates 400,000 40,000,000 350,000 35,000,000 300,000 30,000,000 250,000 25,000,000 200,000 20,000,000 150,000 15,000,000 10,000,000 100,000 5,000,000 50,000 0 0 Date 1-Mar 15-Apr 30-Apr 13-Aug 27-Sep 28-Aug 12-Sep 15-Jan 30-Jan 14-Feb 14-Jun 29-Jun 14-Jul 29-Jul 15-May 30-May 12-Oct 27-Oct 11-Nov 26-Nov 11-Dec 26-Dec 16-Mar 31-Mar 2019 2020 2021 2019 2020 2021 Source: LA Metro, Ridership Statistics Source: Metropolitan Transportation Commission, Monthly Transportation Statistics 5
Transit Riders Lost during COVID BART: Percent of Riders Lost LA Metro: Percent of Riders Lost 1 100% 94% 90% 0.9 80% 0.8 68% 80% 70% 0.7 60% 0.6 50% 0.5 40% 46% 45% 0.4 30% 0.3 20% 0.2 10% 0.1 0% 0 Percent of Riders Lost, 2020 Percent of Riders Lost, 2021 Percent of Riders Lost, 2020 Percent of Riders Lost, 2021 Source: LA Metro, Ridership Statistics Source: Metropolitan Transportation Commission, Monthly Transportation Statistics 6
Bridge Crossings Toll Bridge Crossings & BART Ridership Percent of Travelers Lost, Bay Area Toll Bridges & BART 14,000,000 100% 12,000,000 90% 80% 10,000,000 70% 62% 8,000,000 60% 50% 6,000,000 40% 4,000,000 30% 20% 2,000,000 22% 13% 10% 0 0% 2019 2020 2021 2020 2021 Source: Metropolitan Transportation Commission, Monthly Transportation Statistics 7
Gasoline Consumption: Broadly consistent with bridge crossings California Gasoline Sales, Thousand Gallons per Day Percent Decline in Gasoline Sales 100% 45,000 90% 40,000 80% 35,000 70% 30,000 60% 25,000 50% 43% 20,000 40% 15,000 30% 10,000 14% 20% 12% 5,000 10% 0 0% 2019 2020 2021 2020 2021 Source: EIA, California Total Gasoline All Sales/Deliveries 8
We Know (?) Are Not Consistent with Other Sources California Driving during COVID, 7 Day moving averages Miles per Person, 7 day MA 60 0.90 4.50 50 0.80 4.00 0.70 3.50 40 0.60 3.00 Trips per Day 0.50 2.50 30 0.40 2.00 0.30 1.50 20 0.20 1.00 10 0.10 0.50 0.00 0.00 0 Oct-20 Apr-20 Apr-21 May-20 Jul-20 Mar-20 Nov-20 Dec-20 Aug-20 Sep-20 Jan-20 Jun-20 Jan-21 Mar-21 Feb-20 Feb-21 Work trips/person, 7 day MA Non-work trips/person, 7 day MA (RH axis) Miles per Person, 7 day MA Source: University of Maryland Covid-19 Impact Analysis Platform Source: University of Maryland Covid-19 Impact Analysis Platform 9
Comparison with 2020 Scenarios How does this compare with the scenarios and analysis presented on 22 July 2020: How Much Can Working at Home Reduce GHG Emissions? ? That work analyzed daily commute travel; this work takes a more generalized look at travel not specifically commute. That work measured GHG reduction; this work looks at gasoline consumption and measures of travel. That work expanded the daily analysis to annual analysis in a way that didn t seem to succeed; this work confirms that the extension didn t succeed the annual analysis greatly underestimated the reduction in GHG emissions and gasoline consumption. 10
One Scenario Seems to Fit the Current Data Daily telecommute scenarios Three days per week scenario Possible Statewide Emission Reductions (metric tons CO2e daily) This is GHG emissions, not trips or fuel Includes just a portion of the workforce This shows 18% reduction, but subtract 6% for pre-existing telecommuters gives 12% reduction from COVID telecommuting 140,000 120,000 100,000 80,000 60,000 25% 18% 40,000 10% 6% 20,000 0 Pre-COVID (B) Plus 1 day/week (B + C) Plus 3 days/week (B + D) Plus 5 days/week (B + E) Reductions Emissions Source: How Much Can Working at Home Reduce GHG Emissions? , van der Werf, 22 July 2020 11
Data Shows Broader Reductions than 2020 Scenarios Historical data for all drivers How data compares to scenarios As of April, gasoline sales were 12% below pre-COVID levels, the same reduction as in the 3 day/week scenario Scenario is limited to commuters; this data is for all drivers/vehicles, so the 12% reduction is more general (larger) than the scenario This could change next month/year Percent Decline in Gasoline Sales 100% 90% 80% 70% 60% 43% 50% 40% 30% 14% 20% 12% 10% 0% 2020 2021 Source: EIA, California Total Gasoline All Sales/Deliveries 12
Thank You! Ysbrand van der Werf California Energy Commission Ysbrand.vanderWerf@energy.ca.gov


")
")


” Are Not Consistent with")