Canadian Economic Outlook: The Road Ahead and Beyond
Explore the Canadian Economic Outlook presented by Glen Hodgson, Senior Vice President and Chief Economist at The Conference Board of Canada. Gain insights into the economic projections, including near-term and longer-term perspectives, and understand the impact of factors influencing Canada's economic landscape. Additionally, delve into the U.S. economic forecast, highlighting growth expectations, consumer spending trends, and debt dynamics. Discover the challenges posed by weak Canadian performance amidst resource price fluctuations and a struggling currency. Stay informed and prepared for what lies ahead in the ever-evolving economic environment.
Download Presentation

Please find below an Image/Link to download the presentation.
The content on the website is provided AS IS for your information and personal use only. It may not be sold, licensed, or shared on other websites without obtaining consent from the author. If you encounter any issues during the download, it is possible that the publisher has removed the file from their server.
You are allowed to download the files provided on this website for personal or commercial use, subject to the condition that they are used lawfully. All files are the property of their respective owners.
The content on the website is provided AS IS for your information and personal use only. It may not be sold, licensed, or shared on other websites without obtaining consent from the author.
E N D
Presentation Transcript
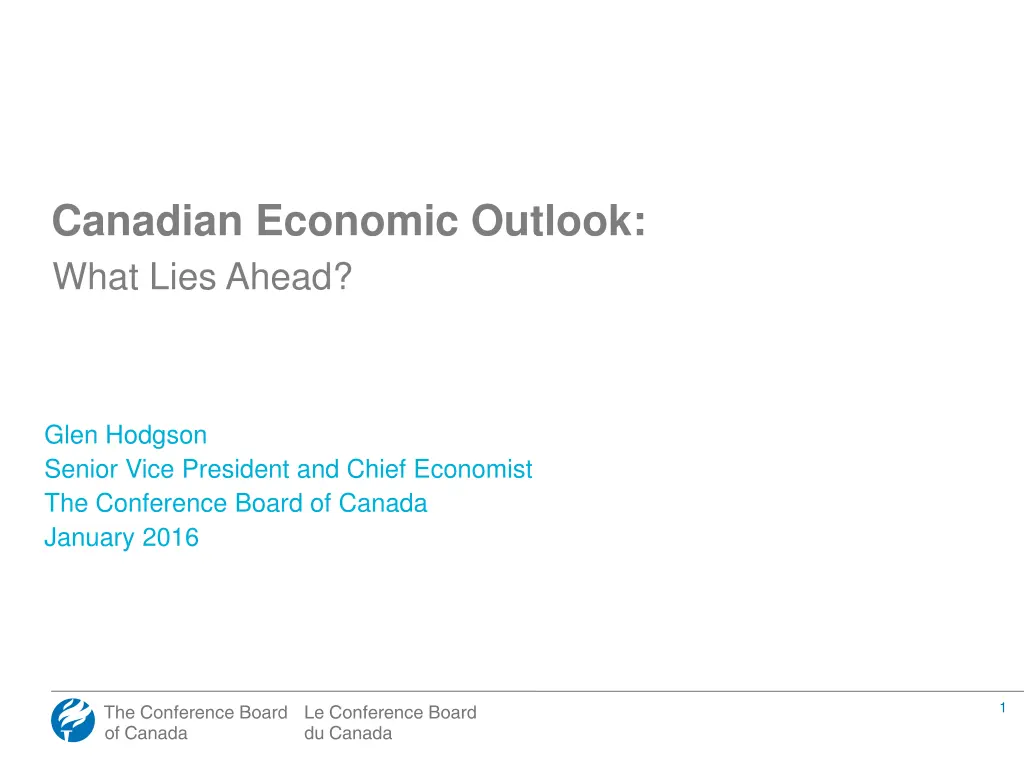
Canadian Economic Outlook: What Lies Ahead? Glen Hodgson Senior Vice President and Chief Economist The Conference Board of Canada January 2016 1
What is The Conference Board of Canada? Objective, independent, unbiased, evidence-based Show big picture Findings carry weight with Canada s leaders, the media, and the general public Canadian Engages with leaders in all sectors private sector, governments, academia, civil society. The Conference Board of Canada offers a world view of global issues We have unparalleled reach and influence across Canada, with connections to more than 200,000 businesses, governments, associations, institutions, and individuals 2
The Economic Outlook: a Primer Two perspectives on the economy s future performance Near-term outlook: based on expenditures by consumers, businesses, governments, external forces i.e. demand for goods and services Longer term outlook: assess the principal factors of production labour, capital, resources, productivity i.e. the key supply factors The Conference Board of Canada projects both demand and supply 3
U.S. Outlook. Growth of close to 3 per cent expected over 2016-17 Better jobs and income are boosting spending on housing, autos and other durables Fed rates increasing -- could lead to capital outflows from some emerging markets Strong greenback is restraining U.S. exports, earnings of multinationals Business investment should ratchet up over next two years 4
U.S. real consumer spending per cent change 4.0 3.5 3.0 2.5 2.0 1.5 1.0 0.5 0.0 -0.5 -1.0 -1.5 -2.0 03 04 05 06 07 08 09 10 11 12 13 14 15f 16f 17f Sources: BEA; The Conference Board of Canada. 5
U.S. Net Debt as a share of GDP per cent 90 85 80 75 70 65 60 55 50 45 40 35 30 Source: IMF 6
U.S. Real GDP Growth per cent change 4.0 3.0 2.0 1.0 0.0 -1.0 -2.0 -3.0 03 04 05 06 07 08 09 10 11 12 13 14 15f 16f 17f Sources: Bureau of Economic Analysis The Conference Board of Canada. 7
Weak Canadian Performance: the New-Normal Real GDP projected to grow 1.8 per cent in 2016 Resource prices remain depressed Weak loonie coupled with strong U.S. consumer should support some export sectors Business investment remains lacklustre Rock bottom oil prices taking a toll on energy sector Job gains are soft -- but aging workforce means labour markets to slowly tighten 8
Raw Material Price Index per cent change 25.0 20.0 15.0 10.0 5.0 0.0 -5.0 -10.0 -15.0 -20.0 -25.0 03 04 05 06 07 08 09 10 11 12 13 14 15e 16f 17f Sources: Statistics Canada; The Conference Board of Canada. 9
Short-Term Interest Rates Canadian Bank Rate and U.S. Federal Funds Rate. 7 Canada United States 6 5 4 3 2 1 0 99 00 01 02 03 04 05 06 07 08 09 10 11 12 13 14 15 16f 17f Sources: The Conference Board of Canada; Statistics Canada. 10
The Loonie and the Oil Price (WTI $US, $US/$C) Dollar (left) Oil Price (right) 1.10 120 1.05 110 1.00 100 0.95 90 0.90 80 0.85 70 0.80 60 0.75 50 0.70 40 0.65 30 0.60 20 Sources: The Conference Board of Canada; U.S. EIA; Statistics Canada. 11
Export Volumes per cent change 6.0 4.0 2.0 0.0 -2.0 -4.0 -6.0 -8.0 -10.0 -12.0 -14.0 Sources: Statistics Canada; The Conference Board of Canada. 12
Real Business Investment non-residential structures and machinery, per cent change 12.0 8.0 4.0 0.0 -4.0 -8.0 -12.0 -16.0 -20.0 03 04 05 06 07 08 09 10 11 12 13 14 15e 16f 17f Sources: Statistics Canada; The Conference Board of Canada. 13
Employment Growth per cent change 2.5 Roughly 150,000 jobs gained 2.0 1.5 1.0 0.5 0.0 -0.5 272,000 jobs lost -1.0 -1.5 -2.0 03 04 05 06 07 08 09 10 11 12 13 14 15e 16f 17f Sources: Statistics Canada; The Conference Board of Canada. 14
Retirement Rate as a share of labour force, per cent 1.20 1.10 1.00 0.90 0.80 0.70 0.60 Source: Statistics Canada. 15
Real Consumer Spending. per cent change 4.5 4.0 3.5 3.0 2.5 2.0 1.5 1.0 0.5 0.0 03 04 05 06 07 08 09 10 11 12 13 14 15e 16f 17f Sources: Statistics Canada; The Conference Board of Canada. 16
Real Government Spending on Goods, Services and Capital, Canada per cent change 4.0 3.5 3.0 2.5 2.0 1.5 1.0 0.5 0.0 -0.5 -1.0 03 04 05 06 07 08 09 10 11 12 13 14 15e 16f 17f Sources: The Conference Board of Canada; Statistics Canada; various government budgets. 17
Canada, Housing Starts vs. Demographic Requirements 000s Housing Starts Household Formation 240 220 200 180 160 140 120 Sources: Canada Mortgage and Housing Corporation; The Conference Board of Canada. 18
Canadian Provinces and Territories 2016 Real GDP by Province. per cent change, basic prices, $2007. -1.5 -1.0 -0.5 0.0 0.5 1.0 1.5 2.0 2.5 3.0 BC MAN ONT NS QUE NB Canada: 1.8 % PEI SASK ALB NL Sources: The Conference Board of Canada; Statistics Canada 19
Labour Force Growth average annual compound growth, per cent 2.0 1.5 1.0 0.5 0.0 1981-90 1991-00 2001-05 2006-10 2011-20f 2021-30f 2031-35f Sources: Statistics Canada; The Conference Board of Canada. 20
Real GDP Canada average annual compound growth, per cent 3.0 2.5 2.0 1.5 1.0 0.5 0.0 1981-90 1991-00 2001-05 2006-10 2011-20f 2021-30f 2031-35f Sources: Statistics Canada; The Conference Board of Canada. 21
Implications End of the commodity super-cycle; domestic growth therefore remains soft in 2016 Big differences among regions -- shift in economic gravity back toward central Canada Aging demographics means slower Canadian growth potential 2 per cent growth is the new normal How to raise growth potential? Faster productivity growth 22

