Canadian Public Finance Issues: Taxation Complexity & Fiscal Federalism
The article delves into Canadian public finance challenges including carbon taxation, complexity of Personal Income Tax (PIT) compliance costs, and issues surrounding fiscal federalism. It explores the unique tax powers of provinces and the federal government, major spending areas, and the apportionment formula for Corporate Income Tax (CIT) between provinces.

Download Presentation

Please find below an Image/Link to download the presentation.
The content on the website is provided AS IS for your information and personal use only. It may not be sold, licensed, or shared on other websites without obtaining consent from the author.If you encounter any issues during the download, it is possible that the publisher has removed the file from their server.
You are allowed to download the files provided on this website for personal or commercial use, subject to the condition that they are used lawfully. All files are the property of their respective owners.
The content on the website is provided AS IS for your information and personal use only. It may not be sold, licensed, or shared on other websites without obtaining consent from the author.
E N D
Presentation Transcript
Carbon taxation; PIT compliance costs& complexity; Fiscal federalism. Three Canadian public finance issues Fran ois Vaillancourt Emeritus professor, economics, Universit de Montr al and Fellow CIRANO November 2024,Japan
Content 1. 2. 3. Personal Income Taxation PIT: complexity and compliance I. Background II. Measuring Complexity III. Measuring Compliance costs IV. Combining measurements V. More compliance costs results 4. Fiscal federalism ; emerging issues Background information on Canada Carbon taxation of end user :a Ponzy scheme or a Slutsky equivalence
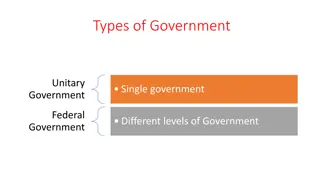
1)Background on Canada 10 provinces 3 territories and 600+ embedded First Nations Provinces and federal government have same taxing powers except for custom duties and excise fees Unique (?) Gambling rental payment for sole occupancy by provinces Provinces are responsible for the delivery of education and health services (70% of health spending is public with health/GDP 12%) Federal is old age pensions then transfers to provinces Major federal-provincial transfers are per capita block grants and fiscal capacity equalisation total 3% GDP;20% federal spending NO Furusato Nozei ! Total G/GDP 41-42% Provinces + local 70% of G
Figure 2 All Government current spending, Main items % 2018-2019 16.0% 2.3% 24.1% 5.0% 9.2% 13.9% 2.1% 23.6% 1.3% 2.5% General services Defence Public order & safety Economic affairs Environment Housing & community Health Recreation culture Education Social protection
Share of specific taxes in all taxes, %, Canada, 2018-2019 15.7% 42.4% 11.8% 16.4% 13.8% Personal income tax Comsumption general All other taxes Corporate income tax Property taxes
CIT formula apportionment between provinces : general ( 80% CIT) + 9 specific (6 listed) Sector General 50% weight each column if not specified Wages and salaries Gross revenues Banks Wages&salaries 1/3rd Deposits loans 2/3rd Railways Airlines Equated track miles Non flying assets 25% Ton-miles Plane miles 75% over province Grain elevator Bushels received Wages &salaries Buses & truck Km by province Wages& salaries Pipelines Length in province Wages& salaries
2)Carbon pricing in Canada 8 Federal Greenhouse Gas Pollution Pricing Act Two tools used: Fuel charge federal or provincial Federal price is floor (backstop) 80$/ton in 2024 then 15$ increase per year to 170$ in 2030 Everywhere except: Qu bec with market based pricing linked to California BC (first in 2008) prices at 80$ and NWT Output Based Pricing System (OBPS) federal or provincial Federal G decides if provincial plan OK or not Federal fuel charge= Climate Action Incentive Payment =Canada Carbon Rebate
Climate Carbon Rebate 9 Set according to expected provicial revenue ( carbon intensity(electricity generation ) 90% of total More than tax paid (simulations) for 4 poorest quintiles 10% for special groups :First nations ,rural remote Since 2024 no taxation of fuel oil (targets Atlantic Canada voters) Axe the tax slogan of Conservative federal opposition; elections planned in 2025 Slutsky compensation: opportunity for demand estimation aggregate and household data
Climate Action Incentive Ontario Alberta+BC+QC Payment amount 10 Province Ontario Alberta BC Qu bec Single 1st adult 2024$ Spouse 50% of this Rural supplement Income targeting 560 900 504 0 112 180 X 0 NONE YES 2% of Y treshold --
3)PIT Complexity and Compliance i)background 14 sets of rates (federal, 10 provinces, 3 territories) setting bodies federal Canada Revenue Agency (CRA)collects the federal, provincial and territorial PIT in all provinces and territories except in Qu bec where the provincial PIT is collected by Revenu Qu bec. So 2 PIT returns in Qu bec and provincial annexes elsewhere Return due April 30th NO prefilled (pre-populated) income tax return
Increasing PIT diversity in CRA provinces 12 Coefficients of variation, Four indicators, Provincial PITs, Nine CRA provinces, Canada, 2001,2008, 2016 0.5 0.47 0.45 0.38 0.4 0.37 0.34 0.35 0.29 0.3 0.26 0.23 0.25 0.22 0.18 0.2 0.17 0.16 0.15 0.15 0.1 0.05 0 Min Y Low bracket Min Y high bracket rate low bracket 2016 rate high bracket 2001 2008
3)PIT Complexity and Compliance ii)Complexity What is tax complexity ? Ulph 2013 distinguishes Design and Operational Complexity Design avoid unnecessary tax complexity but accept fundamental complexity Operational is similar to compliance costs Measurement is hard: readability ? Hoppe et al 2021 TaxComplexity Index (CIT): tax code complexity and tax framework complexity ( legislative/administrative processes of a tax system) Survey of experts
Complexity Methodology correlated indices for Canada 14 Complian Tax Legal Administrative ce activity: Policy framework document activity Tax Tax Length of Length of Compliance measure: expenditures legal texts documents costs
Complexity Measurement-2 15 Index of number of PIT tax expenditures, Canada,1981-2014 1.27 1.40 1.25 1.24 1.12 1.20 1.03 1.02 1.02 1.00 1.00 1.00 0.80 0.60 0.40 0.20 0.00 1981 1988 1991 1996 2001 2006 2011 2013 2014
Complexity Measurement 16 Index text area ,Federal income tax code, Canada,1971-2018 6.0 5.0 4.9 4.6 5.0 4.0 3.13.4 4.0 2.8 3.0 3.12.8 3.0 2.0 2.0 1.0 1.0 0.0 1971 1975 1981 1985 1986 1990 1994 1999 2004 2009 2014 2018
Complexity measurement -3 17 Size index,PIT forms, Nine CRA provinces, Canada,2000-2015 3.3 3.2 3.5 3.0 3 2.5 2 1.5 1 1 0.5 0 2000 2005 2010 2015
Measuring Compliance costs History of thought First studies in the 1930s :stopwatch time and motion studies of cashiers collecting retail sales taxes in the US states Cedric Sandford is the pioneer post WWII using surveys rather than direct observations Australian scholars Evans Pope Tran- Nam Move away from measurement to actionable changes
iii)Measuring Compliance Costs - Methodology Need to collect own data thus Choice of survey type :face to face internet Choice of survey period: risk of unique costs Choice of object: one or several taxes Choice of geography: region country multi- country Individuals: Valuation of time: observed wage gross or net, imputed wage, no wage Business: Accounting or taxation costs; In-house or Outside work Both: costs linked to tax compliance or tax optimisation linked to tax avoidance
Surveys, PIT, Canada,adults Vaillancourt(1989) Vaillancourt, Roy- 20 Study Grine, Vaillancourt Vaillancourt, Li Cesar Barros(2013) (2023) (2024) Tax year 1985-1986 2007-2008 2018-2019 2022-2023 collection Face to face Phone survey Internet panel , Internet panel method interviews 05-06 04-05 05-06 , 05 N= 1682 2000 2 669 1 523 Completion mode : 1)yourself 2) friend or family unpaid ; 3) paid prepare r 1) Yourself Paper implicit Software PC or Software Paid or free Explicit other years internet
Surveys PIT-2 21 1985 and 2007 2018 2022 Three questions on time One question Two questions Time sorting & preparing How much money TIME: How much time did you need to spend to documents and time was prepare and file your 2022 personal income tax Time gathering required for this return(s)? List like 1985-2007. information task? with space $ How much did you spend (for software, for tax Time filling the tax for responses of preparer services) to be able to prepare return(s) time and $ your 2022 personal income tax return? One question on amount paid Four in total
Static findings Two universal findings Regressivity of compliance costs : ratio of CC/income is decreasing Higher costs for self employed Canada Rental owners face higher costs Some type of investment income attract higher costs
Completion mode 2008-Individuals % extremes Self software Friend, family, or Paid tax preparer Self paper not-for-profit form 9 21 20 50 25 34 age 65+ 14 8 19 59 <high school 8 4 30 58 Post-grad 21 26 15 38 Wages 15 21 15 49 Self employment 8 16 7 69
CC-Individuals time-costs- MEAN 2008 extremes direct appeals/ d.c. Hours H H Total $ spent $ total d. c. $ all compliance compliance planning activities All tax filers 4.99 1.97 7.16 61.39 173.25 216.53 4.58 1.70 6.66 50.12 129.42 166.39 <$10,000 8.07 5.09 13.16 77.72 385.09 481.11 $150,000+ < high Sc. 4.24 1.06 5.22 56.42 134.14 159.50 Post-grad 6.48 3.82 10.50 59.38 224.78 303.25 5.21 7.40 2.32 3.55 7.74 10.74 60.16 103.25 191.64 292.03 239.95 389.32 Wages Self-employed
Four years findings Preparation mode: - 1 Canada 25 Share of three preparation modes PIT return, Canada, 1985,2007,2018 ,2023; % 60 51 49 46 50 40 39 37 33 40 31 28 30 18 14 14 20 10 0 1985 2007 friend/family 2018 2022 self expert $
Four years findings Preparation mode:- 2 Canada Explicit paper and software user, shares in total PIT returns, % Canada, 1985, 2007,2018, 2023 26 42 45 39 40 33 35 30 25 17 20 14 15 7 7 10 0 5 0 1985 2007 2018 2022 paper form own software
Four years findings Compliance costs, Canada 27 Mean hours by personal income tax return, Canada ,1985,2007, 2018, 2022 5.6 6.0 5.0 5.0 4.0 2.6 3.0 2 2.0 1.0 0.0 1985 2007 2018 2022
Table2 Total compliance costs, personal income tax filers, $ and % GDP, Canada, 1985, 2007, 2018, 2022 1985 2007 2018 2022 Million $ 1 951 4 318 4 024 4171 current % GDP 0,39 % 0,33 % 0,18 % 0,15% % PIT 3,60% 1,68% 1,08% 0,87% revenue
Compliance costs 29 Factors explaining the drop in compliance time: i. a generalised increase in the use of software to prepare PIT returns; ii. improvements in the ease of use of software over time due to work by software providers; iii. more knowledge acquired /retained by software user; iv. increased use of on-line (banking sites) payment of tax liabilities; v. an increased use of information downloaded from the CRA and RQ websites to fill the software tax returns.
3 iv Combining complexity and compliance costs four years ,Canada Income tax complexity , PIT compliance costs and Tax pain indices, Canada, 1985-2022 30 1.6 1.38 1.33 1.4 1.26 1.10 1.2 1.07 1.06 1 1 1 0.93 1 0.8 0.74 0.8 0.6 0.4 0.2 0 1985 2007 2018 2022 Income tax complexity federal min PIT compliance costs min PIT pain index
Fiscal federalism emerging issues 1)Legal challenge for equalisation: formula does not meet constitutionnal statement June 2024 by Newfoundland 2)National programs of Dental care and Pharmacare: a substitute for age adjusted health transfers? Natural resources use and pricing 3)Greehouse gases underpriced 4)Dissipated hydroelectric rent by underpricing of provincial sales to consumers and businesses with Qu bec main player
1 and 2) Share of population aged 65+ 30.0% 24.6% 20.6%22.2%23.0%21.1% 25.0% 19.8% 18.3%16.8%17.5% 20.0% 15.2% 15.0% 10.0% 5.0% 0.0% NFLA PEI NS NB QC ON Ma Sa Al BC
2)Canadian Dental Care Plan Administered by private insurance firm for the federal government Pays a set fee for service not total cost Household Income tested Not available for privately insured individuals
2) Canadian Pharmacare Curent coverage: reproductive + diabetes Most Canadian have medication insurance private or public Qu bec has backstop public insurance program for 100% coverage Duplicate coverage and coordination issues
3) Share of greenhouse gas and population, Canadian provinces, %, 2021 45.0% 39.1% 40.0% 37.4% 35.0% 30.0% 25.0% 21.9% 21.5% 20.0% 13.8% 15.0% 11.8% 11.9% 10.6% 9.7% 10.0% 3.6% 3.0% 2.6% 2.9% 5.0% 2.1% 2.3% 2.0% 1.3% 1.1% 0.4% 0.2% 0.0% NFLA PEI NS NB QC ON Population Ma Sa Al BC Greenhouse
Merci Thank You Arigato gozaimasu


Background on Canada")


Carbon pricing in Canada")


PIT Complexity and Compliance")

PIT Complexity and Compliance")


Measuring Compliance Costs -")


 Share of population aged")
Canadian Dental Care Plan")
 Canadian Pharmacare")
 Share of greenhouse gas and population, Canadian")