Cannula Placements in Infralimbic Cortex: Photomicrograph Illustration
A photomicrograph displaying cannula placements in the infralimbic cortex for experiments. Further analyses and data visualization provided for varenicline impact on responses and performance in the 3-CSRTT paradigm.

Download Presentation

Please find below an Image/Link to download the presentation.
The content on the website is provided AS IS for your information and personal use only. It may not be sold, licensed, or shared on other websites without obtaining consent from the author.If you encounter any issues during the download, it is possible that the publisher has removed the file from their server.
You are allowed to download the files provided on this website for personal or commercial use, subject to the condition that they are used lawfully. All files are the property of their respective owners.
The content on the website is provided AS IS for your information and personal use only. It may not be sold, licensed, or shared on other websites without obtaining consent from the author.
E N D
Presentation Transcript
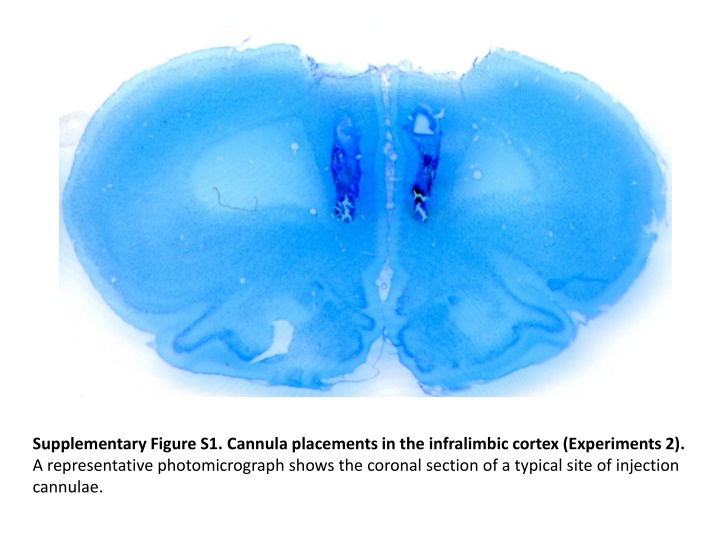
Supplementary Figure S1. Cannula placements in the infralimbic cortex (Experiments 2). A representative photomicrograph shows the coronal section of a typical site of injection cannulae.
Increase rate of premature responses (%) r = - 0.21 by varenicline 0.075 mg/kg The number of premature responses at vehicle Supplementary Figure S2. Scatter plot of the number of premature responses at vehicle and the increase rate of premature responses by varenicline (0.075 mg/kg) administration (Experiments 1 and 2). Each increase rate was calculated by (premature responses at 0.075mg/kg of varenicline / premature responses at vehicle - 1) x 100.
Premature responses Varenicline (0.075 mg/kg, p.o.) Accuracy (%) Nicotine Pump Nicotine Pump 12 13 14 15 16 17 18 10 4 5 6 9 7 8 1 2 3 Day Omissions 12 13 14 15 16 17 18 10 4 5 6 9 7 8 1 2 3 Day Supplementary Figure S3. Time course of main parameters in the 3-CSRTT during Experiment 5.
Perseverative responses Correct response latency (s) Varenicline (0.075 mg/kg, p.o.) Nicotine Pump Nicotine Pump Responses during time-out Reward latency (s) 12 13 14 15 16 17 18 10 4 5 6 9 7 8 1 2 3 12 13 14 15 16 17 18 10 4 5 6 9 7 8 1 2 3 Day Day Supplementary Figure S4. Time course of other parameters in the 3-CSRTT during Experiment 5.
Varenicline (0.075 mg/kg, p.o.) pump out pump in Water (3 ml/kg, p.o.) 3 4 5 6 7 8 9 10 11 12 13 14 15 16 17 18 19 day 2 1 Nicotine infusion withdrawal Correct response latency (s) Perseverative responses * Accuracy (%) Premature responses * Responses during time-out * Reward latency (s) Omissions Water Varenicline Water Varenicline Water Varenicline Water Varenicline Supplementary Figure S5. the effects of varenicline on performance in the 3-CSRTT after discontinuing nicotine infusion (n=5). The average performances during the period surrounded by dotted lines were used for the comparison. * p < 0.05.

")


")