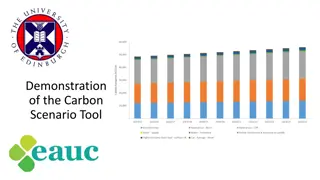
Carbon Calculation for Sustainable Farming
Explore the importance of carbon calculation in achieving net-zero emissions for sustainable farming practices. Learn about different carbon calculator tools, considerations for selection, GWP concepts, and the four pillars of ES Data Group.

Uploaded on | 0 Views
Download Presentation

Please find below an Image/Link to download the presentation.
The content on the website is provided AS IS for your information and personal use only. It may not be sold, licensed, or shared on other websites without obtaining consent from the author. If you encounter any issues during the download, it is possible that the publisher has removed the file from their server.
You are allowed to download the files provided on this website for personal or commercial use, subject to the condition that they are used lawfully. All files are the property of their respective owners.
The content on the website is provided AS IS for your information and personal use only. It may not be sold, licensed, or shared on other websites without obtaining consent from the author.
E N D
Presentation Transcript
ES Data Group 2022 Future Farm carbon calculation report 2023-12-13
Contents Pillars Why doing a carbon calculation Things to consider while selecting a carbon calculator tool GWP vs GWP* IPCC AR4, AR5 AR6 What has changed System boundaries Carbon calculation What next?
Four Pillars of ES Data Group Sustainable Farm Network Farm data systems Carbon calculations Long Term Experiments
Why doing a carbon calculation? We have set ourselves the target of being net-zero for Scope 1 and 2 carbon by 2030. Scope 1 Direct CO2 emissions, caused by own sources within the organization. This concerns emissions from own buildings, transport and production- related activities Scope 2 Indirect CO2 emissions from the generation of electricity or heat purchased and consumed by the farm.
Carbon Calculators Carbon calculators are useful tool to look at business-farm efficiency Plan future management and baseline current position Provides an alternative lens to look at the efficiency and operations
Things to consider while deciding which tool to use practical Does it cover everything the farm produces? What levels of footprint are provided? How easy is the data entry process does it requires support, API s? How much does it cost? Can it make comparisons?
Things to consider while deciding which tool to use - Technical Is it independent? Is it accredited? Is it regularly updated and improved, using the most up-to-date science based information? How does it cover methane and nitrous oxide emissions? Does it count GWP and GWP*? Is it counting carbon sequestration? Is it associated with a key agricultural institution?
What is GWP100 and GWP* Global Warming Potential (GWP) describes how much impact a gas will have on atmospheric warming over a period of time compared to carbon dioxide. The most commonly used GWP measure is GWP100, meaning the average warming potential over 100 years. GWP* models the impact of methane, taking into account its faster decay time of 12 years, and gives a clearer picture of the true warming effect of the short-lived gas.
GWP100 GWP* Currently only for methane (But could expand to other short- lived GHGs) Covers all GHGs Average warming potential over 100 years Warming effect over time, but accounting for breakdown of methane Focuses on fixed quantities of emissions Focuses on change in rate of emissions over time Currently requires emissions data over 20 years Can use emissions data over any timespan More accurate representation of methane s impact Less accurate representation of methane s impact Growing recognition, and IPCC have acknowledged its existence - but so far no official national or international level adoption Formally adopted in international climate policy https://ahdb.org.uk/knowledge-library/what-is-gwp
IPCC Assessment Reports The last three Assessment Reports released were: AR4 (2007) AR5 (2014) AR6 (2022) Tier I reporting standards use default figures published by the IPCC which provide a general estimate of greenhouse gas emissions Tier II reporting standards are slightly more specific as they use national research to generate country-specific emission factors. Tier III reporting uses process-based models to predict emissions with the greatest accuracy and system-specificity.
Whats changed? August July January December AR4 AR5 System boundaries All farm activities People
System Boundaries Baseline Baseline Repeatable Repeatable Commercially relevant Commercially relevant 2022 data
Total emissions from farming 6,598,295 kg CO2 Sequestered by forestry/hedgerows 417,740 kg CO2 Net Emissions from land use in 2022 6,180,555 kg CO2
Enteric fermentation largest factor for dairy sheep and beef. Manure and feed have large impact
Not all gases are equal! CO2 is the standard that GHG are measured against (CO2e) 1kg CH4 = ~48kg CO2 GWP100 value 28 1kg N2O = ~265kg CO2 GWP100 value 265
6,598,295 CO2e CO2 CH4 N2O 3,910,464 CO2e 1,904,164CO2e 796,832 CO2e Manure management Enteric fermentation Inorganic soil input Crop residues Manure applications Direct Indirect 14% 68% 5% 83% 86% 32% 12%
Kg CO2 each year fluctuating Poor year - maize Accuracy of data weight of calves % direct CO2 vs total ~1% difference between 2020 and 2022. Indirect farm practices are main contributor biggest gains to be made!
What next? GWP100 and GWP* calculations ES and farm project calculations 2023 calculation Sensitivity analysis understanding the algorithm Comparing calculations?
A huge thank you! Alice Rogers Eric Siquerios Ed Haris Farm Staff Estates staff Grounds staff Finance department Anyone else who s fed into the calculation Without you all, it would not have been done!