Caste-based Poverty and Inequality in India: Unveiling Sub-caste Disparities
This study delves into the intricate link between caste, poverty, and social discrimination in India, focusing on sub-caste disparities. It sheds light on the associations, heterogeneity, and correlations between caste groups, poverty, and social exclusion, emphasizing the need for targeted policies to address entrenched inequalities.

Download Presentation

Please find below an Image/Link to download the presentation.
The content on the website is provided AS IS for your information and personal use only. It may not be sold, licensed, or shared on other websites without obtaining consent from the author.If you encounter any issues during the download, it is possible that the publisher has removed the file from their server.
You are allowed to download the files provided on this website for personal or commercial use, subject to the condition that they are used lawfully. All files are the property of their respective owners.
The content on the website is provided AS IS for your information and personal use only. It may not be sold, licensed, or shared on other websites without obtaining consent from the author.
E N D
Presentation Transcript
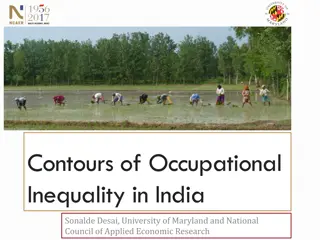
The Lottery of Birth Remains: Poverty and Inequality Within and Between Socio-religious Groups in India Authors Mahtab Alam, International Institute for Population Science Srinivas Goli, International Institute for Population Science Shirin Azam, University of Oxford Discussant Shohei Nakamura, World Bank The 38th IARIW General Conference, London, August 30, 2024 1
Motivation Caste groups remain the most significant determinants of lifetime opportunities, source of embarrassment, and social and economic discrimination (Borooah et al, 2014; Deshande & Ramachandran et al. 2017; Mosse, 2018). Quantitative associations between caste groups beyond broad groups like SC, ST, OBC and poverty/inequality in India are understudied partly due to data limitation. Understanding heterogeneity between different caste groups is crucial to design effective policies to support the most deprived. A household survey collected in Uttar Pradesh is valuable data to showcase how to assess caste- level poverty and inequality and quantify marginalization and social exclusion. 3
Literature Lower caste people face economic and social disadvantages (Deaton & Dr ze 2005; Kumar et al. 2009; Pradhan et al. 2002; Thorat et al. 2017; Borooah et al. 2016; Mosse 2018; Nandwani 2016). The significance of caste-based inequality intensifies hierarchical dominance and involves the narrowing down of entitlement to economic and social rights from the top to the bottom (Sen 2004). Kijima and Lanjouw (2005) shows lower endowments of physical and human capital possessed by disadvantaged groups and different income generation structures contribute equally to the disparities among caste groups. Poverty and inequality extends beyond income deprivation to social and cultural inequalities: social exclusion and marginalization (Hasan & Mehta 2006; Nandwani 2016; Jungari & Bomble 2013; Kabeer 2000). 4
Objectives and hypotheses The objectives of the study are 1) to measure multiple indices of poverty and inequality in consumption, wealth, and landholding at the sub-caste level and 2) to assess the relationship between poverty and social discrimination process, as well as the impact of affirmative action. Hypotheses 1. Socially deprived castes experience higher poverty levels in Uttar Pradesh 2. Social discrimination or untouchability practices lead to higher poverty levels. 3. The provision of human opportunities by the state results in lower poverty levels. 5
Key findings Strong association between caste and poverty and various other socio-economic outcomes. The study also observed heterogeneity and inequalities at the sub-caste level. Social exclusion and poverty are highly correlated. Access to social safety programs explains a significant portion of wealth/consumption variations. The various quantitative methods and indices are tested useful to assess multifaceted deprivations within/across caste groups. Nation-wide data collection with caste information is recommended. 6
Data A household survey collected by the Giri Institute of Development Studies (GIDS) in Uttar Pradesh in 2014/15 Sample size: 7,101 households Sampling: Multi-stage stratified random sampling with Gram Panchayats/Villages/Wards as the PSU. Coverage: 14 districts (out of 75 districts in UP), including 6 from Western, 2 from Central, 5 from Eastern, 2 from Bundelkhand Villages only with a mix of different caste groups were selected. 7
Methods Key variables are measured as follows. FGT: poverty rates, poverty gaps, and squared poverty gaps (Foster et al. 1984) Human Opportunity Index (HOI) = ? (1 ?) where D is the dissimilarity index (De Barros 2009). Blinder-Oaxaca decomposition (Blinder 1973; Oaxaca 1973) Food insecurity index (Goli et al. 2021) Social exclusion and untouchability index Pyatt s Gini decomposition (Pyatt 1976) 8
H1: Lower caste Higher poverty The results suggest that inequalities estimated using social groups misleads the group-level distributions as between-group inequalities make significantly lower contributions. However, the scenario is completely reversed when we use sub-caste to estimate and decompose economic inequalities. 12
Relevance Caste and poverty (and other deprivations) is highly relevant to various fields, such as development economics/studies, poverty/inequality measurement, etc. The paper nicely demonstrates the usefulness of data with detailed caste information and showcases various quantitative approaches to measure/analyze associations between caste and socio-economic outcomes. Good policy implications 18
Clarification questions Enumerators visited nearby PSUs if they were homogeneous in terms of caste, but such an arrangement could create a serious bias (e.g., the data missing those in homogenous villages)? Would district-level analysis (e.g., scatterplots) be feasible, given that only 14 out of 75 districts are included in the data? Rather than visually judge correlation, should it be quantified? Why HOI is used to measure access to state aid, even if there is a variable about access to social safety programs? 19
Suggestions It would be better to organize the results section around the hypotheses. Some hypotheses sound causal (e.g., social discrimination leads to higher poverty), but the data cannot test them. Instead of showing equations of FGT (which is pretty common nowadays), it is better to explain the social exclusion index, which is currently explained only in the Annex (which shows only the list of questions, lacking explanations about how to create an index). Unlike Gini, Theil index can be decomposed into within and between components without overlapping components. It would be good to explain how poverty and wealth index are measured. It would be useful to explain what vertical/horizontal inequality means. 20