Causality and Variable Relationships
Explore concepts like causality, bivariate associations, and probabilistic relationships in variables. Understand the significance of Non-linear relationships, Spurious relationships, and the role of Independent and Dependent variables. Learn about different measurement levels of variables and how they impact the relationships.
Download Presentation

Please find below an Image/Link to download the presentation.
The content on the website is provided AS IS for your information and personal use only. It may not be sold, licensed, or shared on other websites without obtaining consent from the author. If you encounter any issues during the download, it is possible that the publisher has removed the file from their server.
You are allowed to download the files provided on this website for personal or commercial use, subject to the condition that they are used lawfully. All files are the property of their respective owners.
The content on the website is provided AS IS for your information and personal use only. It may not be sold, licensed, or shared on other websites without obtaining consent from the author.
E N D
Presentation Transcript
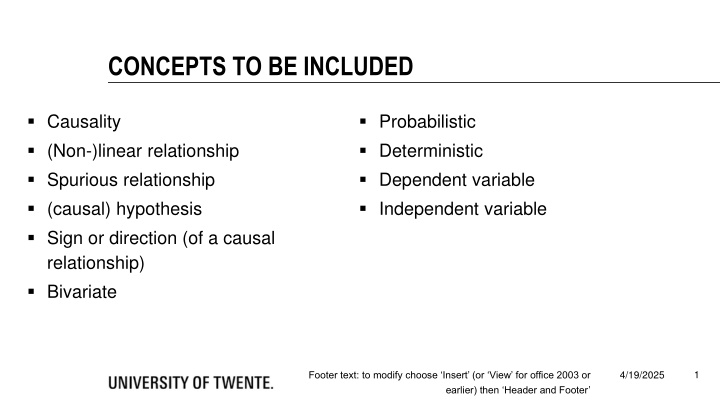
CONCEPTS TO BE INCLUDED Causality (Non-)linear relationship Spurious relationship (causal) hypothesis Sign or direction (of a causal relationship) Bivariate Probabilistic Deterministic Dependent variable Independent variable 1 4/19/2025 Footer text: to modify choose Insert (or View for office 2003 or earlier) then Header and Footer
BIVARIATE ASSOCIATIONS HENK VAN DER KOLK
AIM Causality: Time order, Association, Non-spurious relationship. Bivariate associations between variables with various levels of measurement. 3
A RELATIONSHIP BETWEEN TWO VARIABLES Exogenous concept Cause X-variable Independent variable Treatment Endogenous concept Effect / Consequence Y-variable Dependent variable Observation 4
CAUSALITY IN A GRAPH Positive Dependent variable SIGN Negative Independent variable 5
Non linear: parabolic Non linear: quadratic Dependent variable Linear negative Independent variable 6
PROBABILISTIC Deterministic: If then always Probabilistic: If then relatively more/less often 7
PROBABILISTIC CAUSALITY IN A GRAPH 7 6 5 4 3 2 1 0 0 2 4 6 8 10 12 14 16 8
WHY PROBABILISTIC ONLY? Measurement error Parsimoneous models: omitted variables 9
MEASUREMENT LEVELS OF VARIABLES Dichotomous Gender (male, female) of a person Nominal Country in which the headquarter of a company is located Innovative power of a company (low, medium, high) IQ scores of employees Profits or losses of a company Ordinal Interval Ratio 10
RELATING VARIABLES Using graphs to show causal relationships works fine when using interval - or ratio level variables. How to show the relationship between dichtomous and nominal variables? 11
PROBABILISTIC CAUSALITY IN A TABLE Two dichotomous variables Independent variable A B Total Dependent I X x variable II X x Total 12
PROBABILISTIC CAUSALITY IN A TABLE Two ordinal variables, or nominal variables (with columns and rows ordered by expectation) Independent variable B A C X Total I x x Dependent II III X variable x x X x x Total 13
THIS MICRO LECTURE Causality: Time order, Association, Non-spurious relationship. Bivariate associations between independent and dependent variables with various levels of measurement 14
15 4/19/2025 Footer text: to modify choose Insert (or View for office 2003 or earlier) then Header and Footer


