Central Tendency and Spread in Data Analysis
Explore measures of central tendency and spread, including averages, outliers, and distributions of data through frequency polygons and box plots. Learn how to calculate mean, median, mode, standard deviation, and identify outliers. Understand the impact of data errors on statistical measures.

Download Presentation

Please find below an Image/Link to download the presentation.
The content on the website is provided AS IS for your information and personal use only. It may not be sold, licensed, or shared on other websites without obtaining consent from the author. If you encounter any issues during the download, it is possible that the publisher has removed the file from their server.
You are allowed to download the files provided on this website for personal or commercial use, subject to the condition that they are used lawfully. All files are the property of their respective owners.
The content on the website is provided AS IS for your information and personal use only. It may not be sold, licensed, or shared on other websites without obtaining consent from the author.
E N D
Presentation Transcript
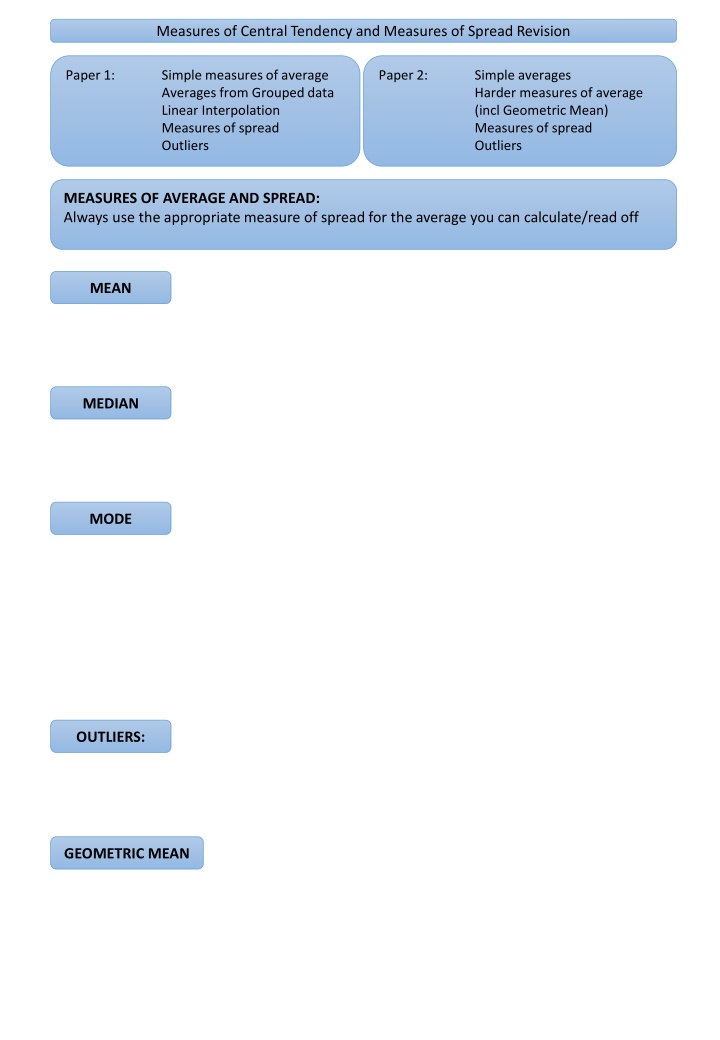
Measures of Central Tendency and Measures of Spread Revision Paper 1: Simple measures of average Averages from Grouped data Linear Interpolation Measures of spread Outliers Paper 2: Simple averages Harder measures of average (incl Geometric Mean) Measures of spread Outliers MEASURES OF AVERAGE AND SPREAD: Always use the appropriate measure of spread for the average you can calculate/read off MEAN MEDIAN MODE OUTLIERS: GEOMETRIC MEAN
1 The frequency polygons below show the numbers of eggs collected by Conor from his hens during February and March 2021. Comment on the distributions
2 The box and whisker plots below show the carbon Monoxide emission for a sample of 100 cars manufactured in 2002 and a sample of 100 cars manufactured in 2016. Comment on the distributions
3 Calculate and estimate for the mean and standard deviation of this data set, you must show all your working: Height Frequency 1 100 < ? 110 0 110 < ? 120 1 120 < ? 130 1 130 < ? 140 3 140 < ? 150 9 150 < ? 160 9 160 < ? 170 5 170 < ? 180 2 180 < ? 190 Hence identify if there are any outliers in this data.:
4 Calculate an estimate for the median for this data set, you must show all your working: Height Frequency 1 100 < ? 110 0 110 < ? 120 1 120 < ? 130 1 130 < ? 140 3 140 < ? 150 9 150 < ? 160 9 160 < ? 170 5 170 < ? 180 2 180 < ? 190 Hence comment on the skew of this data.:
5 Height Frequency 1 100 < ? 110 0 110 < ? 120 1 120 < ? 130 1 130 < ? 140 3 140 < ? 150 9 150 < ? 160 9 160 < ? 170 5 170 < ? 180 2 180 < ? 190 It turns out one of the data values in the interval 180 < ? 190 had been recorded incorrectly and should have been in the interval 170 < ? 180 . Without any further calculations, explain the effect this would have on the mean, median and standard deviation : Mean Median Standard Deviation
6 The percentage voter turn out for the last six general elections is given in the table below Calculate the average voter turn out over the last six general elections Year Percentage turn out 2001 59.4% 2005 61.4% 2010 65.1% 2015 66.2% 2017 68.8% 2019 67.3%
7 Cameron has collected data about the engine size of 200 cars. He has used statistical software to calculate the following summary statistics Mean Standard deviation 1297.3 295.1 Minimum Lower quartile Median 0 1163 1278 Upper quartile 1456.25 Maximum 2350 Range 2350 Interquartile range 293.25 Explain how you can tell that Cameron has not cleaned the data. With reference to the advantages and disadvantages of the different measures of central tendency, explain whether Cameron should use the mean or the median when analysing this data. Which measure of spread should he use when analysing this data? Explain your decision.