CESEE 25 Years After the Iron Curtain: European Integration and Economic Indicators
"Explore the economic progress of CESEE countries post-Iron Curtain, analyzing GDP per capita, FDI stock, current account balance, and convergence with the Eurozone. Insights from renowned speakers like Dr. Ewald Nowotny. Visualization of data trends from reputable sources like the IMF and wiiw. Discover the impact of European integration and the potential for further growth in the region."
Download Presentation

Please find below an Image/Link to download the presentation.
The content on the website is provided AS IS for your information and personal use only. It may not be sold, licensed, or shared on other websites without obtaining consent from the author. If you encounter any issues during the download, it is possible that the publisher has removed the file from their server.
You are allowed to download the files provided on this website for personal or commercial use, subject to the condition that they are used lawfully. All files are the property of their respective owners.
The content on the website is provided AS IS for your information and personal use only. It may not be sold, licensed, or shared on other websites without obtaining consent from the author.
E N D
Presentation Transcript
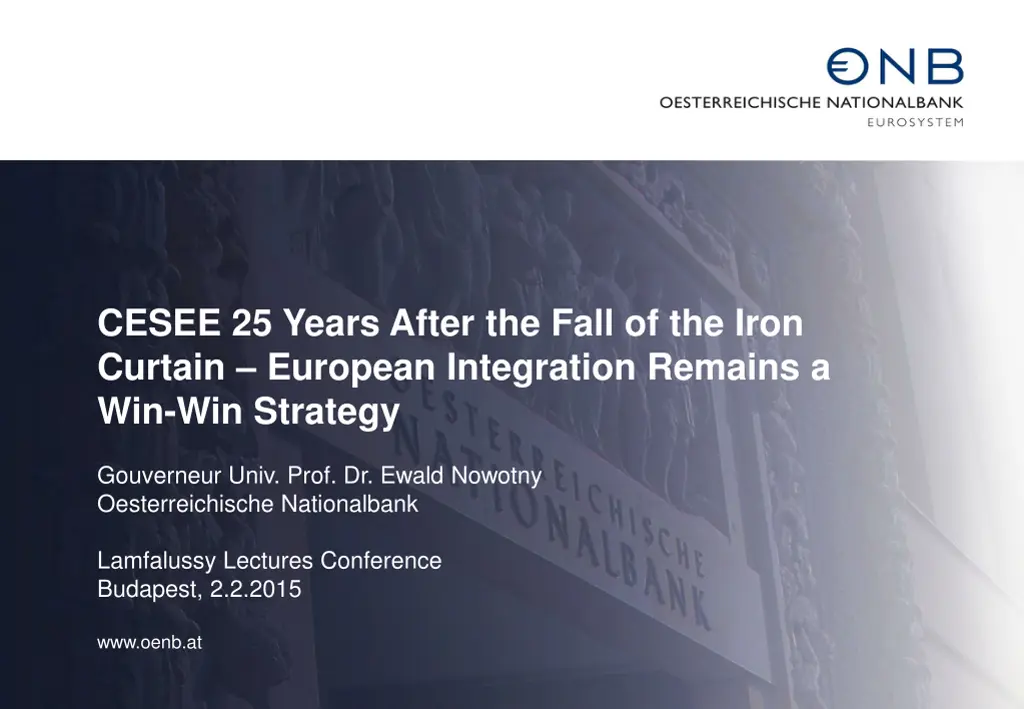
CESEE 25 Years After the Fall of the Iron Curtain European Integration Remains a Win-Win Strategy Gouverneur Univ. Prof. Dr. Ewald Nowotny Oesterreichische Nationalbank Lamfalussy Lectures Conference Budapest, 2.2.2015 www.oenb.at
GDP Per Capita (at PPP) of Selected CESEE Countries in Percent of the EA Average 100 100 90 90 80 80 70 70 60 60 50 50 40 40 30 30 20 20 10 10 0 0 2000 1990 1992 1994 1996 1998 2002 2004 2006 2008 2010 2012 2014 2016 2018 1990 1992 1994 1996 1998 2000 2002 2004 2006 2008 2010 2012 2014 2016 2018 Ukraine S erbia FYR Macedonia Bulgaria Croatia Bosnia and Herzegovina Albania Montenegro Turkey Romania Russia Poland Estonia S lovenia Lithuania Hungary Latvia Czech Republic S lovak Republic S ource: IMF. www.oenb.at oenb.info@oenb.at - 2 -
Inward FDI Stock in % of GDP 140 140 120 120 100 100 80 80 60 60 40 40 20 20 0 0 2010 1990 1992 1994 1996 1998 2000 2002 2004 2006 2008 2012 1992 2004 1990 1994 1996 1998 2000 2002 2006 2008 2010 2012 Turkey Albania Lithuania Ukraine Romania Russia S lovenia Poland Bosnia and Herzegovina Macedonia Latvia S lovakia Czech Republic Estonia Montenegro Croatia S erbia Hungary Bulgaria S ource: wiiw. www.oenb.at oenb.info@oenb.at - 3 -
Current Account Balance in % of GDP 20.0 15.0 10.0 5.0 0.0 -5.0 -10.0 -15.0 -20.0 -25.0 -49.5 -30.0 Romania S lovakia Macedonia Bulgaria Lithuania Russia S lovenia Bosnia and Herzegovina S erbia Estonia Albania Latvia Croatia Ukraine Turkey Hungary Czech Republic Poland Montenegro 1995 2008 2013 S ource: wiiw. www.oenb.at oenb.info@oenb.at - 4 -
Convergence Between CESEE-11 and the Euro Area Simulated convergence paths per capita GDP at P P P in % of Euro area (EA-12) Historic GDP growth differential Year-on-year change in % 1995 2005 2015 2025 2035 2045 2055 2065 5 100 90 4 80 70 3 60 2 50 40 1 30 20 0 Historic convergence process 10 IMF forecast Simulation -1 0 1 percentage point growth differential 2 percentage points 3 percentage points 2006 1996 1998 2000 2002 2004 2008 2010 2012 2014 2016 2018 IMF forecast S ources: OeNB, IMF. www.oenb.at oenb.info@oenb.at - 5 -


