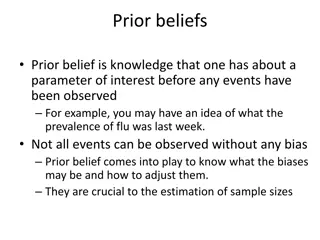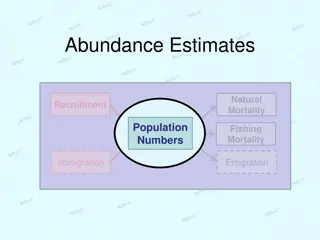
Challenges in Eliciting Contentious Estimates
This research explores challenges faced in eliciting and analyzing estimates in large-scale nuclear decommissioning programs, focusing on Sellafield. It delves into the history of Sellafield, key questions on estimating uncertainties, and the Rumsfeld-iek Window's risk categories.

Download Presentation

Please find below an Image/Link to download the presentation.
The content on the website is provided AS IS for your information and personal use only. It may not be sold, licensed, or shared on other websites without obtaining consent from the author. If you encounter any issues during the download, it is possible that the publisher has removed the file from their server.
You are allowed to download the files provided on this website for personal or commercial use, subject to the condition that they are used lawfully. All files are the property of their respective owners.
The content on the website is provided AS IS for your information and personal use only. It may not be sold, licensed, or shared on other websites without obtaining consent from the author.
E N D
Presentation Transcript
Challenges in the elicitation and analysis of contentious estimates in the field of large scale nuclear decommissioning programmes Jamie Walker Sellafield Limited and University of Strathclyde Management Science Department Tim Bedford and Matthew Revie University of Strathclyde Management Science Department
About Sellafield Location: Cumbria, North West England. Early history: World War II: TNT storage site. 1947: Research site for UK s first atomic bombs. 1956: Windscale fire incident. 1957: World s first commercial nuclear power station. Today: Stores legacy waste in ageing structures. Reprocesses spent nuclear fuel Nearby Moorside site will host a new nuclear power station. 2
About Sellafield 2014 sellafield-700x468 5
Key questions How can estimates be effectively elicited when the subject matter is so contentious, and people may not feel incentivised to give honest opinions? How can an uncertainty model for a programme be empirically compared to reality? How should inter-dependencies between activities be elicited and quantified? Is it useful to quantify dissensus between experts? 6
The Rumsfeld-iek Window (I) Consider Donald Rumsfeld s (in)famous categories of risk: Known knowns: Things that we know that we know (certainties). Known unknowns: Things that we know that we don t know (uncertainties). Unknown unknowns: Things that we don t know that we don t know (pure unknowns). Typical risk training says we should try to minimise the unknown unknowns. 7
The Rumsfeld-iek Window (II) Political philosopher Slavoj i ek has pointed out that Rumsfeld missed a category: Unknown knowns: Things that we don t know that we know. What does this mean though? There are two interpretations: Things we know about, but take for granted to the point that we ve forgotten about them (unconscious assumptions). Things that we know about, but are afraid to talk about openly (unspeakable assumptions or elephants in the room ). i ek s thesis is that there is no clear dividing line between these interpretations, so Rumsfeld s decisions were driven by them. He also argues that our decisions are driven by them too. 8
Typical post-disaster statements After a disaster occurs, responses from representatives are typically: At first: No-one could ever have seen this coming. [Translation: It s no-one s fault.] Then: Our experts might have seen this coming if our analysts had used better identification techniques. [Translation: It s the risk analysts fault.] Then: Our experts did identify the risk, but they underestimated its likelihood. [Translation: It s the experts fault (and partly the analyst s).] Then finally: Our experts did see this coming, they quantified its likelihood properly, and they reported it to the bosses, but their views were disregarded, and strong hints were given that they would be better off not talking about it any more. [Translation: It s the bosses fault (or is it everyone s?).] In other words, conversational processes that don t try to make the unspeakable speakable at the point in time when decisions are being made are very likely to lead to failures. 9
Kleins Pre-mortem (I) Kahneman recommends the use of Klein s pre-mortem technique for qualitative information: Tell the experts to imagine they have a fuzzy crystal ball. The crystal ball shows them that their programme will definitely be a disaster, but it doesn t show why this happened. Experts are then asked to each give three different explanations (in a round-robin format) to identify what went wrong. The process is repeated until participants can no longer think of any more explanations. The approach gives people a sense of emotional distance from things that they find contentious. It would be na ve to think that it makes them become 100% honest though. 10
Kleins Pre-mortem (II) The pre-mortem is effective because it allows experts and analysts to take part in a purely pessimistic form of conversation. This ends up being a bit depressing though, so we then carry out an optimistic pre-mortem that inverts the crystal ball s predictions. This then results in a purely optimistic conversation that then brings out all the things that could be done well. The final step is to have a final conversation which allows both biases to be talked about together. 11
Kleins Pre-mortem (III) It s not so much a de-biasing exercise, as a double biasing exercise. It helps the experts to create targeted actions for uncertainties. As these steps are mainly qualitative, they don t fully help the experts to prioritise their various actions. So we ve adapted the technique to improve our quantitative elicitation techniques too. This then gives us a set of sensitivity analysis charts to help with prioritisation of actions. 12
Typically contentious quantities Risk event impact magnitudes. Time-proximities between now and the occurrence of such events. The costs of maintaining and securing the site. The durations and costs of the site s decommissioning programmes. 13
Quantification (I) Experts are asked to consider the pessimistic pre-mortem s outputs, and suggest a duration estimate for the whole programme that is ridiculously high. This estimate is then considered as an effective P100 (where Pn means the nth percentile or quantile). The experts are then asked to imagine reducing this value until they get to a P95. Here experts assume that no mitigation actions will be carried out. The above process works from the outside in (not the inside out), and it also justifies the P95 via the pre-mortem discussions. 14
Quantification (II) Experts are then asked to give a P80 value. This is still taken from a pessimistic point of view, but less pessimistic than the P95 point of view. The experts are then asked to consider the outputs from the optimistic pre-mortem. The procedure is repeated, but this time starting with a ridiculously optimistic starting point as an initial P0 to then give a reasonable P5. They are then asked for a P20. 15
Quantification (III) The expert are then asked to give a P50 value that s somewhere between the P20 and P80. So we then have a P5, P20, P50, P80, and P95 duration range for the entire unmitigated programme. We then repeat this process for cost to obtain cost estimates at the same percentiles as above. We also discuss how dependent the overall cost of the programme might be on its overall duration via discussions of correlation factors. 16
Quant versus Qual descriptions For general discussion of durations/costs we use: P0 to P5 Ultra optimistic range/value P5 to P20 Very optimistic range/value P20 to P50 Slightly optimistic range/value P50 to P80 Slightly pessimistic range/value P80 to P95 Very pessimistic range/value P95 to P100 Ultra pessimistic range/value 17
Experts reaction to this exercise Once these ranges are obtained, the experts tend to feel that: The five elicited values give a general idea of the unmitigated duration and cost of the programme. The new values are too high to present to their stakeholders, as their P50, P80, and P95 values are much higher than their previous commitments. If they were to build a multi-activity programme with mitigation actions included, the overall duration and costs ranges would end up reducing. It doesn t help them to prioritise their mitigation actions. The experts then wish to help create a more detailed schedule model that will provide them with a useful set of sensitivity analyses for mitigation prioritisation. 18
Methods used so far at SL (V) The general approach to building the detailed model includes: Breaking the model down into sub-activities. Deciding on how each activity is logically dependent on to the others (e.g. series, parallel, or both). Repeating the previous procedure to get the duration and cost ranges of each activity. Adding correlation factors between activities to model dependencies (e.g. human resource sharing between two activities will affect their mutual durations). 19
Methods used so far at SL (VI) Once the new model is produced, its output sensitivity charts are used to identify the key activities that are driving its overall duration and costs. The experts are re-gathered to discuss how their mitigation actions could help them to bring those activities in earlier and/or cheaper. If so, the durations and costs of those activities are re- elicited and the model is re-run. This process is repeated until the experts feel that no more improvements can be made. The final model outputs are then presented to stakeholders for their support or approval. 20
Concerns about the method 1. The iterative process could be exploited by people who want the new targets to be the same as the old targets. Other programmesthat use optimistically biased methodsmight make this one look bad by comparison. It doesn t give us any way to empirically check the performance of the project against the model. Dependency factors between pairs of activities are modelled via simple correlation functions. It doesn t help us to identify the key differences of opinion that could affect the programme s future performance. 2. 3. 4. 5. 21
1. Reducing iteration bias Sometimes, the analyst has to assertively intervene in the process. This might involve reminding the experts and decision makers about the problem of unknown knowns and how we are all susceptible to them. Keep good records of the pre-mortems. Keep good records of the previous iterations outputs. There is no panacea to this problem, but it should at least be talked about to try to minimise it. 22
2. Reducing spurious comparisons Start from the top down where the top is the very top of the business. For SL, this is called the nuclear provision estimate it is the total estimated duration and cost of closing the site (currently 105 years and 50bn). This way, every major programme will have the new method applied to it during the same process. In the meantime, steps need to be taken to make sure that stakeholders and decision makers are properly informed of the method. And how their uninformed reactions to it could end up causing extra problems and overspends later on. 23
3. Empirical checking (I) Our model software can give a monthly breakdown of future spends in terms of probability distributions. In principle, we could comparea programme s Actual Costs (AC) and Earned Value (EV) against each month s distributions. This could be done via Classical (Cooke s) techniques. For example, a number of month s worth of AC and EV data could be used as realisations to compare against the probability distributions. These comparisons could help us to get an idea of how well calibrated the model is. 24
3. Empirical checking (II) This should be done with caution though arguably, the purpose of the analysis is to prove itself wrong, but wrong in the right direction. We also need to be cautious about using EV as a performance measure. Its related Schedule Performance Index (SPI=EV/Planned Cost) always equals 1 for completed programmes, no matter how early or late they finished. The people giving percentage completion data are usually incentivised to over-estimate it. Bayesian techniques could be used to use AC and EV to updatethe model s set of prior distributions to give more accurate posteriors. 25
4. Being dependent on copulas (I) The model software uses a very simple approach to correlations between activities. The user chooses two activities, and then applies a correlation factor between their duration uncertainty (DU) ranges. This factor can be between -100% and +100% (its default value is 0). The software then builds a correlation function (copula) using the activities DU ranges and the pairwise factor. This forces the analyst to use simplistic methods to elicit correlation factors from experts. 26
4. Being dependent on copulas (II) The method is quick, but it doesn t allow the experts to refine the shape of the correlation function (for example, to give it fatter tails ). It is difficult to ascertain if this is really a problem or not. We need some kind of empirical check to compare the model s output copulas to their measurable equivalents (AC and EV). This would give us an idea of how realistic the copulas are. It would also give an idea of the experts judgements of correlation. 27
5. Making dissensus useful (I) The usual aim of expert elicitation is to obtain individual estimates and then combine them to give something more accurate. This technique is obviously useful to the field of programme estimation. But given the inherent level of subjectivity of programme performance, it might be more useful to focus on dissensus over consensus. This would require us to elicit individual estimates and correlation functions from experts. 28
5. Making dissensus useful (II) Typical examples of dissensus: Construction engineers tend to think that design engineers underestimate the effect of small improvements . Stakeholders tend to think that programme teams overestimate their percentage completion levels on activities. The differencebetween the experts most recent probability distributions, and ones they gave a number of years ago. Arguably, an individual s probability distribution is an example of their levels of dissensus with themselves. Different experts might also disagree on how two activities should be correlated in the model (either positively or negatively). By identifying the largest disagreements early, we might be able to minimise disruptions to the programme before they can begin. This is a kind of dissensus based sensitivity analysis. 29
5. Making dissensus useful (III) The last example (correlation dissensus) reminds us of the difference between correlation and dependency. For example, if we have: Y = WX Where X is normally distributed with mean 0 and variance 1; And W is a coin-toss random number generator with W = -1 or +1. Then: Y and X are fully dependent on each other. Y and X are completelyuncorrelated. 30
5. Making dissensus useful (VI) File:Uncorrelated sym.png The Y = WX scattergraph looks like this: (Source: Wikipedia) 31
5. Making dissensus useful (VI) If we had two experts who disagreed on the correlation relationships between two activities. As in, one said the correlation should be positive, while the other said it should be negative. Then shouldn t their combined correlation function look something like the Y = WX one? An alternative method (using a simple circular scattergraph instead) could lead us to missing a key source of dissensus here. 32
Further questions to conclude What s the best way to quantify dissensus? Is Cooke s discrepancy measure (based on relative information ) suitable for this? Can Cooke s method be used when our realisations are so subjective, and we want our models to be wrongly calibrated but in the right direction ? Can Bayesian methods be used for updating opinions based on subjective realisations? What s the best way to elicit correlation functions? What s the best way to empirically test our correlation functions against subjective realisations? Will Donald Rumsfeld ever talk about the unknown knowns? Thank you for listening! 33


")
")

")
")
")

")
")
")


")
")


")
")
")
")
")
")
")
")
")