Challenges in Statistics Integration for Brunei's Long-Term Development Plan
Delve into the complexities of integrating statistics into Brunei's long-term development plan, highlighting implications, strategies, and the importance of statistical data and information.
Download Presentation

Please find below an Image/Link to download the presentation.
The content on the website is provided AS IS for your information and personal use only. It may not be sold, licensed, or shared on other websites without obtaining consent from the author. If you encounter any issues during the download, it is possible that the publisher has removed the file from their server.
You are allowed to download the files provided on this website for personal or commercial use, subject to the condition that they are used lawfully. All files are the property of their respective owners.
The content on the website is provided AS IS for your information and personal use only. It may not be sold, licensed, or shared on other websites without obtaining consent from the author.
E N D
Presentation Transcript
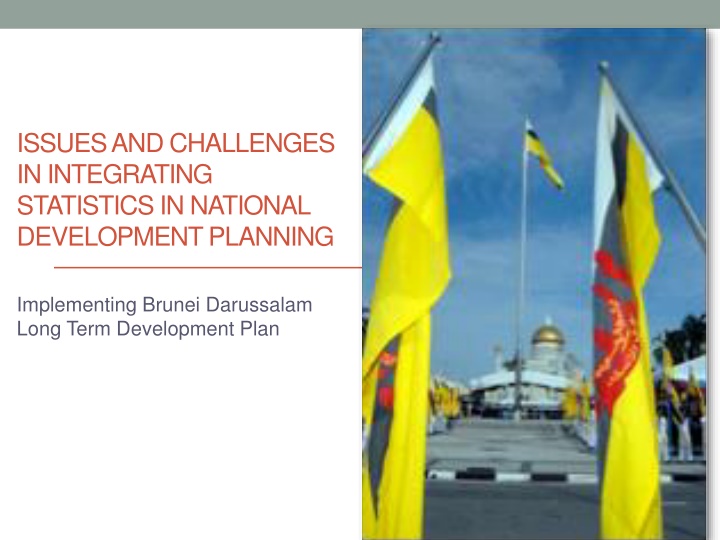
ISSUES AND CHALLENGES IN INTEGRATING STATISTICS IN NATIONAL DEVELOPMENT PLANNING Implementing Brunei Darussalam Long Term Development Plan
CONTENTS Introduction 1. Implementing Brunei Long Term Development Plan (LTDP) 2. Implications for Statistics 3. Conclusion 4.
INTRODUCTION Implementation stage of Brunei Darussalam LTDP: Wawasan Brunei 2035 (30 years) 3 Outline of Strategies and Policies for Development (10 year each) Second medium-term plan, 10th National Development Plan Three levels of information Long term goals, targets and objectives Key performance indicators Measurement indicators & Milestones Implications to statistics
BRUNEI DARUSSALAM LONG TERM DEVELOPMENT PLAN STRUCTURE 3 LONG TERM GOALS BENCHMARK AGAINST INTERNATIONAL INDICATORS 8 DEVELOPMENT STRATEGIES 7 50 POLICY DIRECTIONS DEVELOPMENT PROJECTS AND IMPLEMENTATION PLANS NATIONAL DEVELOPMENT PLANS
Mapping the Process of Formulating the Next OSPD and NDP: Methodologies List out the respective input and outcome KPIs for the government organizations 2035 8 Goal Identify the respective government organizations that would be responsible in carrying out the policies and reforms 1 Divide goal into sub-goals 7 Sub-goal 1 Sub-goal 2 Sub-goal n List out the policies and reforms that need to be implemented in order to realize the key areas 6 2 Set the targets for each of the sub-goals (2035) 4 Divide the sub-goals into key areas Key area 1 Key area 2 Key area n 5 Now 3 Set the targets for the milestone (2017) Set the targets for each of the key areas
IMPLICATIONS FOR STATISTICS Importance of the availability of quality and consistent information and statistical data: Effective statistical database system Basic Data and Baseline Information Benchmarks and Targets Key Performance Indicators Early warning system and diagnostics Manpower availability Continuous capacity building Institutional development: National Statistics Committee (NSC) International bodies commitment and collaboration ACSS, IMF, etc.
Example of Statistical Data NATIONAL STRATEGIC GOALS No Strategic Goals KPI (Measures) Target 1 Stable macroeconomic environment Gross Domestic Product (GDP) Per Capita To be in the Top 10 Income Per Capita Unemployment rate 3 4% unemployment rate Inflation rate Below 2% inflation rate Trade balance Trade surplus 2 Diversified economy Contribution to GDP Agriculture, Fishing and Forestry 10 Industry 50% Services 40% ?
Example of Statistical Data Real GDP growth and growth contributions By looking at statistical indicators, analyst will be able to identify not only issues but also underlying variables measure the importance of policies in addressing issues; Statistical data should be simple understandable; 5.0 4.4 4.0 3.9 Overall GDP (% change) 3.4 Non-oil and gas (percentage points, pp) 3.0 2.9 2.6 2.5 2.3 2.1 2.1 2.0 1.9 1.8 1.6 1.5 1.2 1.1 1.0 1.0 0.9 that could 0.5 0.5 0.4 0.4 0.2 0.0 2003 2004 2005 2006 2007 2008 2009 2010 2011 2012 -0.6 -1.0 -1.2 -1.4 -1.8 -1.9 -2.0 -2.2 -3.0 Oil and gas (pp) -3.1 -3.7 -4.0 and -5.0 30 Source: JPKE
Effective statistical coordination and communication through National Statistical Committee (NSC) The NSC was established on 1st February 2011. NSC is a high level forum which comprised of Permanent Secretaries from all ministries in Brunei Darussalam. The NSC is chaired by the Deputy Minister at the Prime Minister s Office.
Objectives of NSC 10 To ensure Brunei Darussalam National Statistics is in line with the International Standards; To set priorities for statistics produced in accordance with the current needs that can be used for planning and policy developments; To coordinate with the Government Agencies on the collection, compilation and dissemination of statistics; and To ease and ensure the timeliness of statistical dissemination.
Improvements Made Through the NSC Review of the Statistics and Census Acts; Human capacity building for all stakeholders; Developing and implementing MOU s with non- governmental agencies; Establishing Statistics Unit in all ministries; and Coordinate with other agencies in conducting surveys or census.
Conclusion Good statistics and sound statistical analyses assist in providing the basis for the design of policies and plans, monitor policy implementations and implications, achieve issues recognition, evaluate policy impact and forecast the future; and Evidence based policy making is desirable because it enhances the transparency of policy making and the accountability of policy makers.

