Challenges of Population Aging and Intergenerational Equity
Society faces economic impacts as the population ages, affecting the distribution of income and care services. Understanding intergenerational equity is crucial for sustainable support systems.
Uploaded on Feb 18, 2025 | 2 Views
Download Presentation

Please find below an Image/Link to download the presentation.
The content on the website is provided AS IS for your information and personal use only. It may not be sold, licensed, or shared on other websites without obtaining consent from the author.If you encounter any issues during the download, it is possible that the publisher has removed the file from their server.
You are allowed to download the files provided on this website for personal or commercial use, subject to the condition that they are used lawfully. All files are the property of their respective owners.
The content on the website is provided AS IS for your information and personal use only. It may not be sold, licensed, or shared on other websites without obtaining consent from the author.
E N D
Presentation Transcript
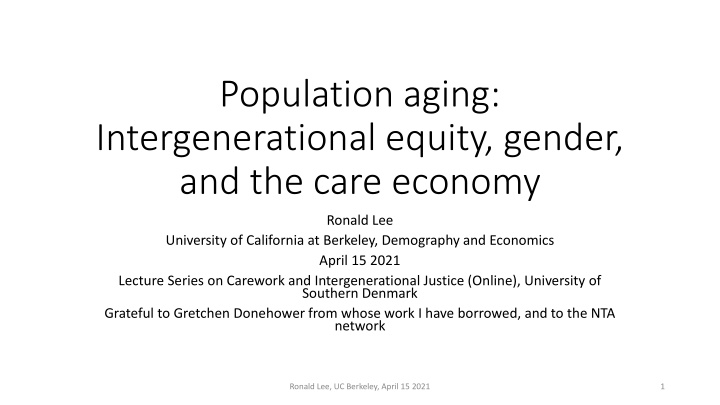
Population aging: Intergenerational equity, gender, and the care economy Ronald Lee University of California at Berkeley, Demography and Economics April 15 2021 Lecture Series on Carework and Intergenerational Justice (Online), University of Southern Denmark Grateful to Gretchen Donehower from whose work I have borrowed, and to the NTA network Ronald Lee, UC Berkeley, April 15 2021 1
Preface Many people sense that society is treating the young unfairly. Elderly now receive generous public pensions, health care and long-term care. These public programs are mostly unsustainable, will be less generous when the young grow old: higher taxes and lower benefits. Environmental concerns on top of economic ones. I will not discuss the environmental topic. I will focus on economic aspects of intergenerational equity and care- giving. Ronald Lee, UC Berkeley, April 15 2021 2
Two economic effects of population aging 1. Population aging means slower pop gr and more elderly relative to working ages . These changes affect total and per capita economic output (GDP) and wages and interest rates. Size of the economic pie and its primary distribution to individuals. 2. Population aging also affects the secondary distribution of income, which is passed on to children and the elderly who have little labor income and yet must consume. Families raise kids (food, housing, clothing etc.); grandparents may help or be helped Public sector taxes workers and asset holders and gives benefits to others public education for kids pensions for elderly health care mostly for elderly This secondary redistribution is the main worry with population aging. Ronald Lee, UC Berkeley, April 15 2021 3
Talk has three parts, focuses on intergenerational equity and redistributions 1. Intergenerational equity and case of US. 2. The economic consequences of population aging 3. Taking caregiving into account. Ronald Lee, UC Berkeley, April 15 2021 4
1. Intergenerational equity Ronald Lee, UC Berkeley, April 15 2021 5
What is intergenerational equity? Intergenerational fairness means that future patterns of support (public and private transfers) for children and the elderly are similar to those in place today. Keeping a generational contract . In a world without change this would be possible and straightforward. With economic growth patterns of support must be interpreted in proportion to rising income or lifetime earnings, not in fixed amounts. For example, a pension would replace the same proportion of annual earnings in the future and the pension taxes or contributions should be the same proportion of earnings. Ronald Lee, UC Berkeley, April 15 2021 6
But there are other changes also disrupt the generational contract. Population aging Life expectancy is rising. Fertility has fallen. Changing economic life cycle: elderly consume relatively more and work less than before. New public transfer programs are introduced, old ones are modified. Returns to human capital have increased (educ wage differences). Health care costs rise faster than productivity growth. Ronald Lee, UC Berkeley, April 15 2021 7
Low fertility disrupts generational contract in other ways, many of them good. More education when fertility is low. More time and attention from parents. Inherit more wealth when parents assets are divided among fewer children. Gets better jobs because fewer competitors. Ronald Lee, UC Berkeley, April 15 2021 8
But low fertility also brings costs to the smaller generations. Fewer to support their parents and grandparents. Requires more personal care time from each grown child Requires paying higher taxes to support public programs for elderly. Ronald Lee, UC Berkeley, April 15 2021 9
Hard to say whether society treats young generations fairly. Should the young be able to retire at the same age as their parents did? They will live 6 years longer than their parents; shouldn t they also work longer? Perhaps the young should retire for the same proportion of their adult lives as their parents. Means working longer. And the young have fewer children than their parents or grandparents, raising fewer working people to support them. Fairness requires they work even longer Germany and Sweden have pension structures that work in this direction. Ronald Lee, UC Berkeley, April 15 2021 10
Here are key results from two papers that try to calculate what the young get First paper focuses just on public sector, and compares what generations get over their lifetimes. Second paper looks at newborn in 2010 and calculates what it gets from both public and family.s Ronald Lee, UC Berkeley, April 15 2021 11
Here we calculated what each generation gets over lifetime through main public programs, net of taxes The Metric: Net Present Value (NPV) at birth of public benefits received minus taxes paid over lifetime Takes into account survival and discounting. Major project requiring many assumptions. Antoine Bommier, Ronald Lee and Timothy Miller, Stephane Zuber (2010) Who Wins and Who Loses? Public transfer accounts for US generations born 1850-2090, Population and Development Review, 36:1, 1-26. PMCID: PMC2840408 Ronald Lee, UC Berkeley, April 15 2021 12
Old age programs are unsustainable. Projections assume that programs are balanced each year 50% by reducing benefits & 50% raising taxes. What generations born 1850 to 2050 get from the government: Net present value of lifetime benefits minus taxes as a percent of lifetime earnings. Children born 1950-2050 do well. *They lose through pensions and health care for elderly *They gain a lot from receiving public educ when young. Green=Total net benefit discounted to birth. One dollar of old age benefits is worth eight dollars of benefits when young (survival and discounting at 3%/yr) Children born from 1950 to 2050 do well. Ronald Lee, UC Berkeley, April 15 2021 13
Results are surprising Today s younger generations do well (born 1950 to 2050). Today s elderly born in the 1930s and 40s are slight losers. Every generation born since 1950 Loses through programs for the elderly, But gains more from rising public education. Big losers will be those generations born after 2050, who will do increasingly badly Ronald Lee, UC Berkeley, April 15 2021 14
Second study public and family transfers What does a newborn receive from earlier generations? Public transfers, including those in first study. Human capital. Social infrastructure. Assets inherited from parents, grandparents and others (bequests and inter vivos). Parental care and support (here material support only, not caregiving) ALSO, but not counted here: Knowledge and technology. Culture and institutions The natural environment. What will newborn give to future generations? Depends on: How many children are born and how they are raised Public policy and private behavior during the parents lifetime. Ronald Lee, UC Berkeley, April 15 2021 15
Here is one attempt to count what newborns in 2010 will receive over their lifetimes in the US and Taiwan. Ronald Lee, David McCarthy, James Sefton, and Jo e Sambt (2017) Full Generational Accounts: What do we give to the next generation? Population and Development Review 43(4): 695 720. Gross, we give a lot, more than the Present Value of lifetime earnings. Ronald Lee, UC Berkeley, April 15 2021 16
Here is one attempt to count what newborns in 2010 will receive over their lifetimes in the US and Taiwan. Ronald Lee, David McCarthy, James Sefton, and Jo e Sambt (2017) Full Generational Accounts: What do we give to the next generation? Population and Development Review 43(4): 695 720. Net it is much smaller. Ronald Lee, UC Berkeley, April 15 2021 17
Here is one attempt to count what newborns in 2010 will receive over their lifetimes in the US and Taiwan. Ronald Lee, David McCarthy, James Sefton, and Jo e Sambt (2017) Full Generational Accounts: What do we give to the next generation? Population and Development Review 43(4): 695 720. Or perhaps it makes most sense to count net public plus gross private. Ronald Lee, UC Berkeley, April 15 2021 18
Here is one attempt to count what newborns in 2010 will receive over their lifetimes in the US and Taiwan. Ronald Lee, David McCarthy, James Sefton, and Jo e Sambt (2017) Full Generational Accounts: What do we give to the next generation? Population and Development Review 43(4): 695 720. None of these counts the unpaid care work contributed by parents. Ronald Lee, UC Berkeley, April 15 2021 19
2. The economic life cycle, the economy and the support ratio I use results from the National Transfer Accounts project (NTA), with thanks to all its country teams. Definitions of measures Labor income is wages and salaries plus 2/3 of self employment income, averaged across all individuals at a given age males, females, and those with zero labor income. Consumption is private household consumption imputed to individuals at each age in household, plus in-kind transfers from government received at each age (education, health care, etc.). Ronald Lee, UC Berkeley, April 15 2021 20
Standardized Labor Income by age; average for countries in income group (ratio to average labour income ages 30-49) Source: Figure 1 in United Nations Department of Economic and Social Affairs Population Division, Technical Paper No. 2017/1 Support Ratios and Demographic Dividends: Estimates for the World Averages for 160 countries. NTA. In High Inc countries Late start due to educ Early retirement Ron Lee, UC Berkeley, Oct 29 2020 21
Average per capita consumption by age for countries by income group (expressed for each country as ratio to average labour income ages 30-49, 160 countries) Source: Figure 2 in United Nations Department of Economic and Social Affairs Population Division, Technical Paper No. 2017/1 Support Ratios and Demographic Dividends: Estimates for the World Ron Lee, UC Berkeley, Oct 29 2020 22
Changing age profile of consumption in the US over 55 years (cross-sectional NTA) Y-axis scale: Relative to the (unweighted) profile average of labor income (YL) value for ages 30-49 for that year. Source: Lee, Donehower&Miller (2011), updated Ronald Lee, UC Berkeley, April 15 2021 23
Support ratio is simplest way to see the economic effect pop aging and dependency Effective labor is sum of NTA baseline labor income age profile times population age distribution. Effective consumers and effective capital are defined in same way These measures change with population size and age distribution. Support ratio (SR) is effective labor/effective consumers. For given productivity of labor, inc per effective consumer is proportional to SR. Demographic Dividend = rate of change of Support Ratio (%/yr) Ronald Lee, UC Berkeley, April 15 2021 24
If pop in working ages grows faster than children and elderly, then support ratio rises. Low-Mid Inc Support Ratio Low-Inc Support Ratio of countries by income level groups High Inc Up-Mid Inc *Upper-Middle-Income countries gained over 1%/yr in cons growth, but only briefly. Demog Div = change in Supp Rat Up-Mid Inc Low-Inc *Lower and Low gain less, but over longer period Low-Mid Inc High Inc *High inc and Upper Middle are now rapidly aging, have negative dividend, losing .5%/yr Ronald Lee, UC Berkeley, April 15 2021 25
From 2000 to 2030, pop aging slows the growth of income per effective consumer by .2%/yr. This is small cost of pop aging, not much to worry about. Milder than for average High Income country. Ronald Lee, UC Berkeley, April 15 2021 26
3. But what about caregiving? The age profiles of labor income and consumption on earlier slides only included paid work and market goods. Now I will show results copied from: Counting Women s Work in an Aging World by Gretchen Donehower and UC Berkeley, and members of the Counting Women s Work research project and National Transfer Accounts research network (November, 2019) Gretchen leads the international project, Counting Women s Work , closely related to National Transfer Accounts (NTA). https://www.countingwomenswork.org/ Unpaid Care Work is UCW in following slides. Ronald Lee, UC Berkeley, April 15 2021 27
Average amount of time spent in unpaid care work (UCW) by age and sex, hours per week. Women always spend much more time in UCS than men. Some convergence at older ages. Ronald Lee, UC Berkeley, April 15 2021 28
Difference in average time spent by type of work, age, and sex, hours per week, male female. Symmetry of age profiles means that men and women spend similar total time. Men always spend much more time in market work. Women always spend much more time in UCW. Ronald Lee, UC Berkeley, April 15 2021 29
If UCW is important economic production, we also have to consider the consumption of UCW. Suppose a man prepares dinner for a family of four goes to the store to buy ingredients Cooks dinner Cleans up Cost of dinner is the cost of ingredients and the cost of the time spent in all these tasks. The time costs are also consumed, not just the ingredients. The man consumes of the full cost of the dinner. The other of the costs are consumed by others in household. Ronald Lee, UC Berkeley, April 15 2021 30
Consumption of market goods and services compared to UCW time. Units of av male labor inc 30-49 for market goods. Units of hours per week for consumption of UCW. *Young children consume very little in market goods, but great deal of UCW. *Elderly consume little UCW (except Vietnam). *Ignoring UCW understates cost of children relative to elderly. *That understates gains from reduced fertility overstates cost of pop aging. Ronald Lee, UC Berkeley, April 15 2021 31
Assigning economic value to UCW hours There is no good way to do it. We use one recommended method replacement cost : value each UCW activity time by the hourly rate for hiring a market specialist to do that work: cooking, child care, elder care, nursing, cleaning etc. Ronald Lee, UC Berkeley, April 15 2021 32
Marketbased labor income compared to UCW valued at replacement wage, by sex, (both as ratios to average male labor income age 30 49). (Donehower, 2019) Ronald Lee, UC Berkeley, April 15 2021 33
Recalculate support ratios counting cost of UCW in both production and consumption Ronald Lee, UC Berkeley, April 15 2021 34
2009-2050 declines .3%/yr for standard support ratio Only .2%/yr with time costs counted. Ronald Lee, UC Berkeley, July 13 2016 35
Literature cited Bommier, Antoine, Ronald Lee and Timothy Miller, Stephane Zuber (2010) Who Wins and Who Loses? Public transfer accounts for US generations born 1850-2090, Population and Development Review, 36:1, 1-26. PMCID: PMC2840408 Lee, R. and G. Donehower (2011) Private transfers in comparative perspective Chapter 8 in R. Lee and A. Mason (eds.), Population Aging and the Generational Economy: A Global Perspective. Edward Elgar. (viewable on the IDRC website http://www.idrc.ca/EN/Resources/Publications/Pages/IDRCBookDetails.aspx?PublicationID=987 Lee, R., G. Donehower, and T. Miller (2011) The changing shape of the economic lifecycle in the United States, 1970 to 2003 Chapter 15 in R. Lee and A. Mason (eds.), Population Aging and the Generational Economy: A Global Perspective. Edward Elgar. (viewable on the IDRC website http://www.idrc.ca/EN/Resources/Publications/Pages/IDRCBookDetails.aspx?PublicationID=987 Lee, Ronald (2019) Population aging and systems of intergenerational transfers inPopulation Histories in Context: Past achievements and future directions. Celebrating the 50th anniversary of the founding of the Cambridge Group for the History of Population and Social Structure. Gretchen Donehower and members of the Counting Women s Work research project (2019) Counting Women s Work in an Aging World Working Paper of Counting Women s Work. Ronald Lee, David McCarthy, James Sefton, and Jo e Sambt (2017) Full Generational Accounts: What do we give to the next generation? Population and Development Review 43(4): 695 720. Andrew Mason, Ronald Lee, Michael Abrigo, and Sang-Hyop Lee (2017) Support Ratios and Demographic Dividends: Estimates for the World Technical Paper, Population Division of the Department of Economic and Social Affairs, United Nations, www.unpopulation.org. NTAccounts.org Ronald Lee, UC Berkeley, April 15 2021 36
