Changes in Diabetic Retinopathy with Treatment
Secondary analysis of a clinical trial comparing Aflibercept, Bevacizumab, and Ranibizumab in managing Diabetic Retinopathy. Insights on the impact of different treatments on progression and improvement of retinopathy over a 2-year period are discussed.

Download Presentation

Please find below an Image/Link to download the presentation.
The content on the website is provided AS IS for your information and personal use only. It may not be sold, licensed, or shared on other websites without obtaining consent from the author.If you encounter any issues during the download, it is possible that the publisher has removed the file from their server.
You are allowed to download the files provided on this website for personal or commercial use, subject to the condition that they are used lawfully. All files are the property of their respective owners.
The content on the website is provided AS IS for your information and personal use only. It may not be sold, licensed, or shared on other websites without obtaining consent from the author.
E N D
Presentation Transcript
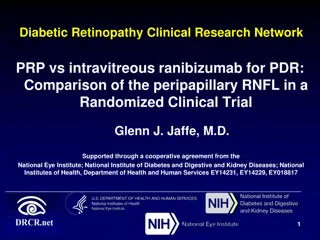
The Diabetic Retinopathy Clinical Research Network Change in Diabetic Retinopathy (DR) Through 2 Years Secondary Analysis of a Randomized Clinical Trial Comparing Aflibercept, Bevacizumab, and Ranibizumab JAMA Ophthalmol. 2017 Jun 1;135(6):558-568. doi: 10.1001/jamaophthalmol.2017.0821. 1
Background Exploratory analyses of changes in diabetic retinopathy level during treatment periods of up to 3 years have shown that eyes randomly assigned to ranibizumab or aflibercept to manage DME, as compared to eyes treated with focal/grid photocoagulation are*: less likely to experience retinopathy worsening and more likely to realize retinopathy improvement. While more limited data is available on the effect of bevacizumab on retinopathy level, similar trends have been suggested.** * VISTA&VIVID, DRCR.net Protocol I, RISE&RIDE. ** BOLT 2
Cumulative Probability of DR Worsening: Protocol I* NPDR group 50% A: Laser B: Ranibizumab + Laser C: Ranibizumab + Def D: Triamcinolone + Laser 37% 40% Cumulative Probability 30% 23% 18% 20% 10% 7% 0% 1 Year 2 Years 3 Years 3 *JAMA Ophthalmology 2013
Cumulative Probability of DR Worsening: Protocol I* PDR group 50% A: Laser B: Ranibizumab + Laser C: Ranibizumab + Def D: Triamcinolone + Laser 40% 40% Cumulative Probability 30% 21% 20% 18% 10% 12% 0% 2 Years 3 Years 1 Year 4 *JAMA Ophthalmology 2013
What we Learned from Protocol I Ranibizumab was associated with a reduced probability of retinopathy worsening relative to laser, in eyes with or without PDR, through 3 years. Improvement of retinopathy occurred between baseline and 1 year in: 25% of eyes with moderately severe NPDR or better (N = 182), and 28% of eyes with severe NPDR or worse (N = 121) Beneficial changes in retinopathy worsening occurred despite decreasing number of injections in years 2 and 3. 5
Purpose of Exploratory Analysis Protocol T Evaluate the effect of intravitreous: aflibercept bevacizumab ranibizumab administered to manage DME, on the risk of worsening or improvement of DR, during a treatment period of up to 2 years. 6
Worsening of DR During follow-up on annual photos Developed retinal detachment Developed NVI or NVA or NVG Between baseline and follow-up Worsened 2 or more levels on the ETDRS retinopathy scale* Developed vitreous hemorrhage Received vitrectomy or injections for PDR Progressed from No PDR to PDR* Worsening of Diabetic Retinopathy Progressed from HRPDR to advanced PDR* Received PRP 7
Worsening of DR During follow-up on annual photos Developed retinal detachment Only applies to eyes with the potential to worsen 2 or more levels* Developed NVI or NVA or NVG Between baseline and follow-up Worsened 2 or more levels on the ETDRS retinopathy scale* Developed vitreous hemorrhage Received vitrectomy or injections for PDR Only applies to eyes without PDR at baseline Progressed from No PDR to PDR* Only applies to eyes with inactive PDR to HRPDR Worsening of Diabetic Retinopathy Progressed from HRPDR to advanced PDR* Received PRP 8 *Based on Reading Center grading of annual fundus photos, excludes eyes with level >81 (advanced PDR)
Improvement of DR Did NOT receive PRP Between baseline and annual follow-up Improvement on annual fundus photos* Did NOT receive vitrectomy or injections for PDR During follow-up on annual photos Improvement of Diabetic Retinopathy Did NOT develop NVI or NVA or NVG Did NOT develop vitreous hemorrhage Did NOT develop retinal detachment 9 *Based on Reading Center grading of annual fundus photos, excludes <20 (MA)
Improvement of DR Did NOT receive PRP to Inactive (if PRP at baseline) or No PDR (if no PRP at baseline)* Improved from active PDR Between baseline and annual follow-up Improvement on annual fundus photos* Did NOT receive vitrectomy or injections for PDR During follow-up on annual photos Improvement of Diabetic Retinopathy OR improved 2 or more levels on the ETDRS retinopathy scale* (applies to eyes with NPDR or PDR with potential to improve 2 or more levels) Did NOT develop NVI or NVA or NVG Did NOT develop vitreous hemorrhage Did NOT develop retinal detachment 10 *Based on Reading Center grading of annual fundus photos, excludes <20 (MA)
Methods Evaluated within each of the 2 DR severity subgroups*: NPDR group 1) Moderate NPDR or better, includes levels 10, 12, 14, 15, 20, 35, and 43 2) Moderately severe to very severe NPDR, includes levels 47, 53, and 53E PDR group 1) PRP without NV (Inactive PDR), includes level 60 2) Mild or moderate PDR, includes level 61 and 65 3) High-risk PDR, includes levels 71 and 75 4) Advanced PDR, includes levels 81 and 85 11 *Based on Reading Center grading of baseline fundus photos
Worsening of DR between Baseline and 2 Years* 12
Cumulative Probability* of DR Worsening NPDR at Entry Aflibercept (N = 174) Bevacizumab (N = 153) Ranibizumab (N = 168) 100% 75% Cumulative Probability P values for pairwise comparison : A vs. B: 0.99 A vs. R: 0.54 R vs. B: 0.54 50% 25% 5% 4% 3% 10% 10% 7% 0% Weeks 0 52 104 * Calculated using the life-table method, adjusted for baseline DR severity Hochberg-adjusted P values for multiple treatment-group comparisons to account for an overall type I error rate of 0.05 13
Cumulative Probability* of DR Worsening (level 47/53 subgroup- mod-severe to severe NPDR) Aflibercept (N = 71) Bevacizumab (N = 62) Ranibizumab (N = 85) 100% 75% Cumulative Probability P values for pairwise comparison : A vs. B: 0.47 A vs. R: 0.13 R vs. B: 0.42 50% 25% 7% 5% 3% 18% 13% 7% 0% Weeks 0 52 104 * Calculated using the life-table method, adjusted for baseline DR severity Hochberg-adjusted P values for multiple treatment-group comparisons to account for an overall type I error rate of 0.05 14
Cumulative Probability* of DR Worsening PDR at Entry Aflibercept (N = 47) Bevacizumab (N = 59) Ranibizumab (N = 49) 100% P values for pairwise comparison : A vs. B: 0.70 A vs. R: 0.70 R vs. B: 0.62 75% Cumulative Probability 50% 26% 25% 14% 18% 13% 17% 4% 0% Weeks 0 52 104 * Calculated using the life-table method, adjusted for baseline DR severity Hochberg-adjusted P values for multiple treatment-group comparisons to account for an overall type I error rate of 0.05 15
Improvement of DR Level between Baseline and Annual Visits* 16
Proportion with Improvement of DR Level* (NPDR at entry) 80% Aflibercept Bevacizumab Ranibizumab P values for pairwise comparison at 1 year : A vs. B: 0.004 A vs. R: 0.51 R vs. B: 0.01 P values for pairwise comparison at 2 years : A vs. B: 0.85 A vs. R: 0.85 R vs. B: 0.85 60% 38% 40% 31% 31% 25% 22% 22% 20% 0% 1 Year (N = 141, 131, 151) 2 Years (N = 133, 113, 129) *Adjusted for baseline DR severity Hochberg-adjusted P values for multiple treatment-group comparisons to account for an overall type I error rate of 0.05 17
Proportion with Improvement of DR Level NPDR subgroup (level 47/53) P values for pairwise comparison at 1 year : A vs. B: 0.62 A vs. R: 0.62 R vs. B: 0.53 100% Aflibercept Bevacizumab Ranibizumab P values for pairwise comparison at 2 years : A vs. B: 0.97 A vs. R: 0.97 R vs. B: 0.97 80% 65% 60% 56% 54% 52% 51% 50% 40% 20% 0% 1 Year (N = 55, 54, 79) 2 Years (N = 55, 46, 68) *Adjusted for baseline DR severity Hochberg-adjusted P values for multiple treatment-group comparisons to account for an overall type I error rate of 0.05 18
Proportion with Improvement of DR Level (PDR at entry) 100% Aflibercept Bevacizumab Ranibizumab P values for pairwise comparison at 1 year : A vs. B: <0.001 A vs. R: 0.02 R vs. B: 0.09 80% 76% P values for pairwise comparison at 2 years : A vs. B: 0.01 A vs. R: 0.06 R vs. B: 0.73 70% 60% 55% 38% 40% 31% 30% 20% 0% (N = 29, 35, 29) 1 Year 2 Years (N = 27, 33, 24) *Adjusted for baseline DR severity Hochberg-adjusted P values for multiple treatment-group comparisons to account for an overall type I error rate of 0.05 19
Improvement of DR Level Sustained Improvement at 2 years Aflibercept 20 (50%) 14 (70%) Bevacizumab Ranibizumab 16 (73%) 7 (78%) NPDR (N = 111) PDR (N = 40) 30 (61%) 7 (64%) 20
Improvement of DR Level Sustained Improvement at 2 years* Aflibercept 20 (50%) 14 (70%) Bevacizumab Ranibizumab 16 (73%) 7 (78%) NPDR (N = 111) PDR (N = 40) 30 (61%) 7 (64%) Initial Improvement at 2 years* Aflibercept 11 (13%) 4 (67%) Bevacizumab Ranibizumab 9 (10%) 3 (13%) NPDR (N = 253) PDR (N = 42) 10 (13%) 2 (15%) 21 *No treatment group differences
Summary Potential limitations: Finite follow-up period of 2 years and higher than ideal numbers of missed visits and annual visits without gradable photographs Limited number PDR patients and baseline DR severity was not a stratification factor for randomization Slight treatment group imbalances on baseline factors: NPDR: bevacizumab group was slightly older; aflibercept group had more participants with type 1 diabetes PDR: Ranibizumab group had more prior PRP, more severe retinopathy; aflibercept group had more severe DME No evidence that the improvement in retinopathy changes the timeline to actual VA loss or need for intervention of any type. Hypothesis to be tested by Protocol W 22
Summary Retinopathy Worsening: In eyes with NPDR at baseline approximately 10% or less, in each group, experienced retinopathy worsening by 2 years. In the small group of eyes with PDR at baseline, 17%, 26%, 18% of eyes had worsening retinopathy in the aflibercept, bevacizumab, and ranibizumab groups. No treatment group differences between the 3 anti-VEGF groups were identified within either of the baseline retinopathy subgroups. Rates are consistent with Protocol I findings Eyes Receiving Anti-VEGF for DME still need to be Monitored for Worsening of Retinopathy 23
Summary # of Eyes in Each Group is Small Retinopathy Improvement: PDR group: Aflibercept appeared superior to bevacizumab or ranibizumab at 1 or 2 years No difference was identified between bevacizumab and ranibizumab at 1 or 2 years. Consistent with the superiority of aflibercept to manage DME in eyes with worse VA or thicker CST. NPDR group: Aflibercept and ranibizumab both appeared to be superior to bevacizumab at 1 year. No treatment group differences between the 3 anti-VEGF groups were identified at 2 years. 24