Chappuis Core Region Slope Analysis
Exploring the slope variations across the Chappuis core region using data analysis and radiometer measurements to understand albedo changes influenced by factors like vegetation, soil composition, and altitude. The study delves into the spectral shape evidence provided by the solar spectrum flux radiometer and emphasizes the importance of identifying and analyzing different land-use components for accurate albedo descriptions.

Download Presentation

Please find below an Image/Link to download the presentation.
The content on the website is provided AS IS for your information and personal use only. It may not be sold, licensed, or shared on other websites without obtaining consent from the author. If you encounter any issues during the download, it is possible that the publisher has removed the file from their server.
You are allowed to download the files provided on this website for personal or commercial use, subject to the condition that they are used lawfully. All files are the property of their respective owners.
The content on the website is provided AS IS for your information and personal use only. It may not be sold, licensed, or shared on other websites without obtaining consent from the author.
E N D
Presentation Transcript
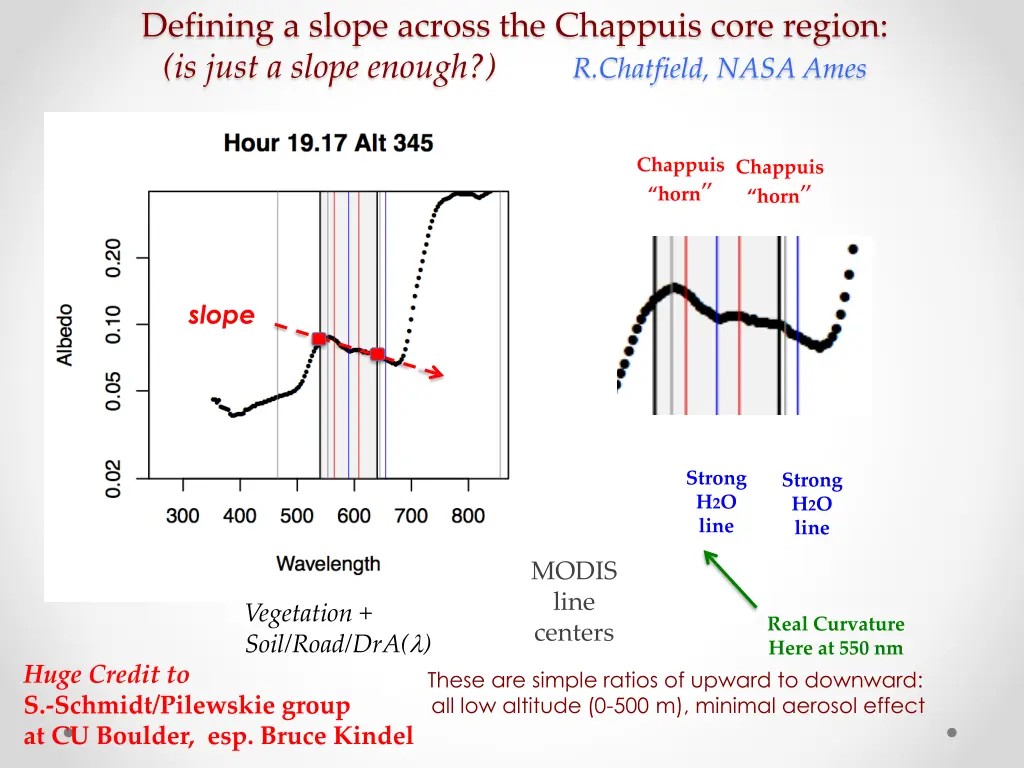
Defining a slope across the Chappuis core region: (is just a slope enough?) R.Chatfield, NASA Ames Chappuis horn Chappuis horn slope Strong H2O line Strong H2O line MODIS line centers Higher Albedo, Vegetation + Soil/Road/DrA( ) Real Curvature Here at 550 nm Huge Credit to S.-Schmidt/Pilewskie group at CU Boulder, esp. Bruce Kindel These are simple ratios of upward to downward: all low altitude (0-500 m), minimal aerosol effect
Solar spectrum flux radiometer (CU-Ames) provides the best-understood, most direct evidence about spectral shape Half of SSFR's signal (not an imager but irradiance radiometer) comes from within a cone that has a ground cross-section about the same as the flight altitude Sebastian Schmidt Flight path north of Houston, 2006, mostly vegetated Credit to S.-Schmidt /Pilewskie group at CU Boulder, esp. Bruce Kindel
Examples of nave albedo from SSFR data: ratio of upward flux to downward flux: this spotlights our concern: -variation Soil/Road/Dry A( ) Vegetation A( ) ? Red Soil ? What happens with drought, Ozone damage? Yellowing? These are simple ratios of upward to downward: all low altitude (0-500 m), minimal aerosol effect
Slopes can change very rapidly over < 6 km, but there are also broad regional patterns slope Higher Albedo, Vegetation + Soil/Road A( ) / Map of slopes, unitless/(1000 nm) August/ September 2013 Variogram shows strong increase of variability of slope up to 10 km, then similar variability up to 40 km
Analysis Overview General direction of tasks: Identify types and mixtures using aircraft data to check and extend pure-land-use (lab) albedo. What might we be missing? Chose components method, paying attention to advice from MODIS land-use scientists. Produce sample dA/d descriptions with 2 3 degrees of freedom per description, or as TEMPO instrument error covariances mandate (do small 10-nm features matter?) MAIAC:Repeat analysis Albedos in MODIS bands at 0.5 1 km resolution, with careful multi-footprint filtering and rationalization (in time and space domains). Lyapustin data will be available to GEO-CAPE (Aerosol) group by late March. R.Chatfield, NASA Ames Robert.B.Chatfield@nasa.gov ADDITIONAL SLIDES
Usefulness of Some RT Modeling Measured Downward (zenith) X 0.1 to fit scale SSFR and spectrum fitting Measured upwards (nadir) (red dots) and shift-Chappuis fit Houston NNW flight analysis, 2900 m at 19.19 UT H2O to zenith should be minimal for samples in this dataset. Downward best-fit upward shifted +0.02 to fit scale (corresponds to ~0.10 to ~0.20 albedo in dataset ), Chappuis spectrum Water spectrum (VPL plot)

 provides")