Chapter 7: Medicare Part D Prescription Drug Coverage in Patients With CKD
Dive into the details of Medicare Part D prescription drug coverage for patients with chronic kidney disease. Explore the parameters, coverage options, and enrollment statistics for CKD and ESRD patients in Medicare. Understand the sources of prescription drug coverage and how it impacts individuals with kidney disease.

Download Presentation

Please find below an Image/Link to download the presentation.
The content on the website is provided AS IS for your information and personal use only. It may not be sold, licensed, or shared on other websites without obtaining consent from the author.If you encounter any issues during the download, it is possible that the publisher has removed the file from their server.
You are allowed to download the files provided on this website for personal or commercial use, subject to the condition that they are used lawfully. All files are the property of their respective owners.
The content on the website is provided AS IS for your information and personal use only. It may not be sold, licensed, or shared on other websites without obtaining consent from the author.
E N D
Presentation Transcript
2016 ANNUAL DATA REPORT VOLUME 1: CHRONIC KIDNEY DISEASE Chapter 7: Medicare Part D Prescription Drug Coverage in Patients With CKD
Figure 7.1 Sources of prescription drug coverage in Medicare enrollees, by population, 2014 Data Source: Data source: Medicare 5% sample. Point prevalent Medicare enrollees alive on January 1, 2014. Abbreviations: CKD, chronic kidney disease; ESRD, end-stage renal disease; LIS, Medicare Low-income Subsidy; Part D, Medicare prescription drug coverage benefit. 2016 Annual Data Report, Vol 1, CKD, Ch 7 2
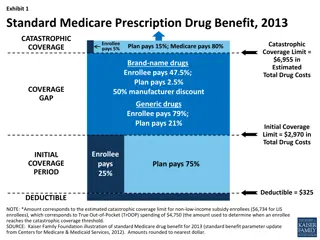
Table 7.1 Medicare Part D parameters for defined standard benefit, 2009 & 2014 2009 2014 Deductible After the deductible is met, the beneficiary pays 25% of total prescription costs up to the initial coverage limit. $295.00 $310.00 Initial coverage limit The coverage gap ( donut hole ) begins at this point. The beneficiary pays 100% of their prescription costs up to the out-of-pocket threshold $2,700.00 $2,850.00 Out-of-pocket threshold $4,350.00 $4,550.00 The total out-of-pocket costs including the donut hole Total covered Part D prescription out-of-pocket spending (including the coverage gap). Catastrophic coverage begins after this point. $6,153.75 $6,455.00 a$2.55 Catastrophic coverage benefit $2.40 a$6.35 Generic/preferred multi-source drug $6.00 aplus a 52.50% brand name medication Other drugs discount 2014 Example: $295.00 $310 $310 (deductible) $601.25 $635.00 +(($$2850-$310)*25%)(initial coverage) $3,453.75 $3,605.00 +(($6455-$2850)*100%)(coverage gap) $4,350.00 $4,550.00 Total $4,350.00 $4,550.00 (maximum out-of-pocket costs prior to catastrophic coverage, excluding plan premium) a The catastrophic coverage amount is the greater of 5% of medication cost or the values shown in the chart above. In 2014, beneficiaries were charged $2.55 for those generic or preferred multisource drugs with a retail price less than $51 and 5% for those with a retail price over $51. For brand name drugs, beneficiaries paid $6.35 for those drugs with a retail price less than $127 and 5% for those with a retail price over $127. Table adapted from http://www.q1medicare.com/PartD-The-2014-Medicare-Part-D-Outlook.php. 2016 Annual Data Report, Vol 1, CKD, Ch 7 3
Table 7.2 General Medicare, CKD, & ESRD patients enrolled in Part D (%) General Medicare All CKD All ESRD 2011 55.7 59.3 69.9 2012 57.6 60.5 71.7 2013 65.7 69.3 75.2 2014 66.3 71.1 76.5 Data source: Medicare 5% sample. Point prevalent Medicare enrollees alive on January 1. Abbreviations: CKD, chronic kidney disease; ESRD, end-stage renal disease; Part D, Medicare prescription drug coverage benefit. 2016 Annual Data Report, Vol 1, CKD, Ch 7 4
Figure 7.2 Sources of prescription drug coverage in Medicare enrollees, by age, 2014 (a) All general Medicare enrollees Data source: Medicare 5% sample. Point prevalent Medicare enrollees alive on January 1, 2014. Abbreviations: CKD, chronic kidney disease; LIS, Medicare low income subsidy; Part D, Medicare prescription drug coverage benefit. 2016 Annual Data Report, Vol 1, CKD, Ch 7 5
Figure 7.2 Sources of prescription drug coverage in Medicare enrollees, by age, 2014 (b) Enrollees with CKD Data source: Medicare 5% sample. Point prevalent Medicare enrollees alive on January 1, 2014. Abbreviations: CKD, chronic kidney disease; LIS, Medicare low income subsidy; Part D, Medicare prescription drug coverage benefit. 2016 Annual Data Report, Vol 1, CKD, Ch 7 6
Figure 7.3 Sources of prescription drug coverage in Medicare enrollees, by race, 2014 (a) All general Medicare enrollees Data source: Medicare 5% sample. Point prevalent Medicare enrollees alive on January 1, 2014. Abbreviations: Blk/Af Am, Black/African American; CKD, chronic kidney disease; LIS, Medicare Low-income Subsidy; Part D, Medicare prescription drug coverage benefit. 2016 Annual Data Report, Vol 1, CKD, Ch 7 7
Figure 7.3 Sources of prescription drug coverage in Medicare enrollees, by race, 2014 (b) Enrollees with CKD Data source: Medicare 5% sample. Point prevalent Medicare enrollees alive on January 1, 2014. Abbreviations: Blk/Af Am, Black/African American; CKD, chronic kidney disease; LIS, Medicare Low-income Subsidy; Part D, Medicare prescription drug coverage benefit. 2016 Annual Data Report, Vol 1, CKD, Ch 7 8
Table 7.3 Medicare Part D enrollees (%) with the Low-income Subsidy, by age & race, 2014 General Medicare All CKD Part D with Low-income Subsidy Part D with Low-income Subsidy White All ages 20-44 45-64 65-74 75+ Black/African American All ages 20-44 45-64 65-74 75+ Asian All ages 20-44 45-64 65-74 75+ Other races All ages 20-44 45-64 65-74 75+ 30.0 92.9 76.0 17.2 21.5 31.9 94.0 77.1 26.4 27.1 67.6 95.3 85.7 49.0 57.9 66.7 94.1 84.7 56.4 63.6 76.5 91.9 85.1 68.4 80.1 80.6 100.0 85.9 74.3 82.3 50.1 92.8 79.2 34.4 47.5 54.3 90.5 83.7 40.8 54.7 Data source: Medicare 5% sample. Point prevalent Medicare enrollees alive on January 1, 2014. Abbreviations: CKD, chronic kidney disease; Part D, Medicare prescription drug coverage benefit. 2016 Annual Data Report, Vol 1, CKD, Ch 7 9
Figure 7.4 Distribution of Low-income Subsidy categories in Part D general Medicare, CKD, & ESRD patients, 2014 Data source: Medicare 5% sample. Point prevalent Medicare enrollees alive on January 1, 2014. Abbreviations: CKD, chronic kidney disease; ESRD, end-stage renal disease; Part D, Medicare prescription drug coverage benefit. 2016 Annual Data Report, Vol 1, CKD, Ch 7 10
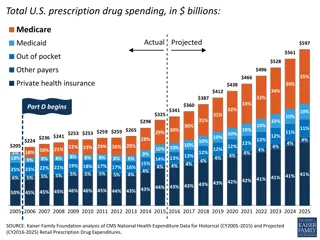
Table 7.4 Total estimated Medicare Part D spending for enrollees (in billions), 2011-2014 General Medicare All CKD All ESRD 2011 40.1 5.2 1.6 2012 35.7 4.8 2.0 2013 45.7 6.8 2.3 2014 50.5 7.7 2.7 Data source: Medicare Part D claims. Medicare totals include Part D claims for Part D enrollees with traditional Medicare (Parts A & B). CKD totals include Medicare CKD patients, as determined from claims. ESRD totals include all Part D claims for Medicare ESRD patients with Medicare Part D stand-alone prescription drug plans. Abbreviations: CKD, chronic kidney disease; ESRD, end-stage renal disease; Part D, Medicare prescription drug coverage benefit. 2016 Annual Data Report, Vol 1, CKD, Ch 7 11
Figure 7.5 Per person per year Medicare Part D spending & out-of-pocket costs for enrollees, 2014 (a) All Part D enrollees Data source: Medicare Part D claims. Medicare totals include Part D claims for Part D enrollees with traditional Medicare (Parts A & B). CKD totals include Medicare CKD patients as determined from claims. ESRD totals include all Part D claims for Medicare ESRD patients with Medicare Part D stand-alone prescription drug plans. Costs are per person per year for calendar year 2014. Medicare Part D spending is the sum of the Medicare covered amount and the Low-income Subsidy amount. Abbreviations: CKD, chronic kidney disease; ESRD, end-stage renal disease; Part D, Medicare prescription drug coverage benefit. 2016 Annual Data Report, Vol 1, CKD, Ch 7 12
Figure 7.5 Per person per year Medicare Part D spending & out-of-pocket costs for enrollees, 2014 (b) Part D enrollees by Low-income Subsidy status Data source: Medicare Part D claims. Medicare totals include Part D claims for Part D enrollees with traditional Medicare (Parts A & B). CKD totals include Medicare CKD patients as determined from claims. ESRD totals include all Part D claims for Medicare ESRD patients with Medicare Part D stand-alone prescription drug plans. Costs are per person per year for calendar year 2014. Medicare Part D spending is the sum of the Medicare covered amount and the Low-income Subsidy amount. Abbreviations: CKD, chronic kidney disease; ESRD, end-stage renal disease; Part D, Medicare prescription drug coverage benefit. 2016 Annual Data Report, Vol 1, CKD, Ch 7 13
Table 7.5 Per person per year Part D spending ($) for enrollees, by Low- income Subsidy status, 2014 General Medicare All CKD All ESRD Part D with Low-income Subsidy Part D remaining enrollees Part D with Low-income Subsidy Part D remaining enrollees Part D with Low-income Subsidy Part D remaining enrollees Age All 20-44 45-64 65-74 75+ 5,302 5,255 7,115 4,572 4,030 1,447 2,060 3,122 1,386 1,329 7,249 10,655 10,928 7,343 5,426 2,318 3,074 4,156 2,801 1,952 10,826 11,386 11,783 9,728 7,826 3,286 2,640 3,859 3,474 2,643 Sex Male Female Race White Black Asian Other race 5,310 5,296 1,556 1,367 7,694 6,978 2,476 2,161 10,925 10,718 3,349 3,190 5,510 4,881 4,858 4,728 1,446 1,513 1,278 1,396 7,506 6,563 7,339 6,708 2,302 2,344 2,750 2,745 10,510 11,325 11,105 7,956 3,318 3,167 3,369 3,319 Data source: Medicare Part D claims. All Medicare patients with Medicare Part D stand-alone prescription drug plans. CKD determined from claims. ESRD patients with Medicare Part D stand-alone prescription drug plans. Costs are per person per year for calendar year 2014. Medicare Part D PPPY is the sum of the Medicare covered amount and the Low-income Subsidy amount. LIS status is determined from the Part D enrollment. A person is classified as LIS if they are eligible for the LIS for at least one month during 2014. Abbreviations: CKD, chronic kidney disease; ESRD, end-stage renal disease; Part D, Medicare prescription drug coverage benefit. 2016 Annual Data Report, Vol 1, CKD, Ch 7 14
Table 7.6 Top 15 drug classes received by Part D-enrolled CKD patients, by percent of patients 2014 Rank Drug class Percent of patients 1 HMG-CoA Reductase Inhibitors (statins) 59% 2 -Adrenergic Blocking Agents 57% 3 Opiate Agonists 46% 4 Loop Diuretics 39% 5 Proton-pump Inhibitors 38% 6 Antidepressants 35% Angiotensin-Converting Enzyme Inhibitors 7 34% 8 Dihydropyridines 33% 9 Quinolones 27% 10 Thyroid Agents 25% 11 Angiotensin II Receptor Antagonists 24% 12 Anticonvulsants, Miscellaneous 23% 13 Adrenals 21% 14 Replacement Preparations 20% 15 Insulins 20% Data source: Medicare Part D claims. CKD patients with Medicare Part D stand-alone prescription drug plans in the Medicare 5% sample. 2016 Annual Data Report, Vol 1, CKD, Ch 7 15
Table 7.7 Top 15 drug classes received by Part D-enrolled CKD patients, by Medicare Part D spending, 2014 Percent of total Medicare Part D spending Medicare Part D spending ($ in millions) Rank Drug class 1 Insulins $1,017.81 13% 2 Antineoplastic Agents $758.01 10% 3 Antipsychotics $288.85 4% 4 Proton-pump Inhibitors $252.85 3% Dipeptidyl Peptidase IV (DDP-4) Inhibitors 5 $240.78 3% 6 Corticosteroids $225.37 3% HMG-CoA Reductase Inhibitors (statins) 7 $223.01 3% 8 Antiretrovirals $209.87 3% 9 HCV antivirals $206.89 3% 10 Opiate Agonists $200.95 3% 11 Anticoagulants $181.25 2% 12 Anticonvulsants, Miscellaneous $178.52 2% 13 Antimuscarinics/Antispasmodics $169.03 2% 14 Antidepressants $167.42 2% 15 Angiotensin II Receptor Antagonists $155.01 2% Data source: Medicare Part D claims. CKD patients with Medicare Part D stand-alone prescription drug plans in the Medicare 5% sample. Part D spending represents the sum of the Medicare covered amount and the Low- income Subsidy amount. 2016 Annual Data Report, Vol 1, CKD, Ch 7 16


 with the Low-income")


 for")