Characterization of Coronary Atherosclerosis in ISCHEMIA Trial
Explore how quantification and characterization of coronary atherosclerosis through coronary computed tomographic angiography (CCTA) can enhance risk assessment for cardiovascular events in the ISCHEMIA trial cohort. Previous studies have shown atherosclerosis to be a significant predictor of major adverse cardiovascular events, with specific plaque features indicating increased risk. Understanding 3D atherosclerosis measures and vascular morphology can provide valuable insights for identifying individuals at risk for cardiovascular death or myocardial infarction.

Download Presentation

Please find below an Image/Link to download the presentation.
The content on the website is provided AS IS for your information and personal use only. It may not be sold, licensed, or shared on other websites without obtaining consent from the author. If you encounter any issues during the download, it is possible that the publisher has removed the file from their server.
You are allowed to download the files provided on this website for personal or commercial use, subject to the condition that they are used lawfully. All files are the property of their respective owners.
The content on the website is provided AS IS for your information and personal use only. It may not be sold, licensed, or shared on other websites without obtaining consent from the author.
E N D
Presentation Transcript
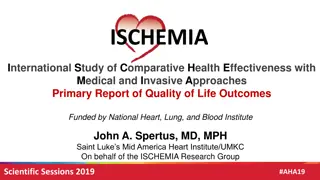
#AHA21 Whole-Heart Atherosclerosis Quantification and Characterization and Risk of Major Adverse Cardiovascular Events: The ISCHEMIA Trial James K. Min, MD, Harmony R. Reynolds, MD, Rebecca Anthopolos, DrPH, Tami Crabtree, MS, G.B. John Mancini, MD, Jonathon Leipsic, MD, Matthew J. Budoff, MD, Cameron Hague, MD, Sean M. O'Brien, PhD, Gregg W. Stone, MD, Jonathan D. Newman, MD, MPH, William E. Boden, MD, Bernard R. Chaitman, MD, Peter H. Stone, MD, Sripal Bangalore, MD, MHA, John A. Spertus, MD, MPH, Daniel B. Mark, MD, MPH, Leslee J. Shaw, PhD, Judith S. Hochman, MD, David J. Maron, MD Presented by Harmony Reynolds on Behalf the ISCHEMIA Research Group
Disclosures Research Support for ISCHEMIA trial - NIH U01 HL105907, HL105462, HL105561 - Devices or medications were provided by Abbott Vascular, Medtronic, St. Jude Medical, Volcano, Amgen, Arbor Pharmaceuticals, AstraZeneca Pharmaceuticals, Espero Pharmaceuticals, Merck Sharp & Dohme, Omron Healthcare, and Sunovion Pharmaceuticals Harmony Reynolds NIH funding for work on the ISCHEMIA trial In-kind donations from Abbott Vascular, Siemens and BioTelemetry James Min Employee / Equity in Cleerly, Inc, where CT quantification analyses were performed Scientific Advisory Board, Arineta Funding by NIH for work on the ISCHEMIA trial Whole Heart Atherosclerosis Quantification and Risk in the ISCHEMIA Trial
Study Objective To determine whether quantification and characterization of coronary atherosclerosis, as determined by coronary computed tomographic angiography (CCTA), would further improve identification of individuals at risk for the composite outcome of cardiovascular death or MI in the ISCHEMIA randomized trial cohort Whole Heart Atherosclerosis Quantification and Risk in the ISCHEMIA Trial
Background Prior multicenter studies have demonstrated atherosclerosis to be a strong predictor of future major adverse cardiovascular events (MACE) CONFIRM1, ICONIC2, SCOT-HEART3 and PROMISE4 Specifically, high-risk plaques those that exhibit low-density non-calcified plaque composition and positive (outward) arterial remodeling have been linked to future MACE1-4. Additional 3D atherosclerosis and vascular morphology measures are correlated with adverse outcomes: Plaque burden and morphology Plaque location Plaque diffuseness 3D Lumen volume 1Hadamitzky M et al. J Am Coll Cardiol 2013; 2Chang HJ et al. J Am Coll Cardiol 2018; 3Williams M et al. Circulation 2020; 4Ferencik M et al. JAMA Cardiology 2018 Whole Heart Atherosclerosis Quantification and Risk in the ISCHEMIA Trial
Methods Atherosclerosis Quantification Performed on Every Coronary Artery and Branches Diffuse plaque w/ # of >30% stenosis Lumen volume/vessel length Low-density non-calcified plaque volume Total plaque volume Proximal Location Low Density: <30HU High-risk plaque: Remodeling index >1.1 & low density plaque Performed using software as a service at Cleerly, Inc Stented segments were excluded from atherosclerosis quantification but were evaluated for stenosis; any bypass grafts were not evaluated; sensitivity analysis excluded patients with prior CABG; calcified plaque defined based on >350HU
Statistical Methods For this analysis, the primary endpoint was CV death or MI (number of events=399) Three time points (based on primary trial event curves):6 months, 2 years, 4 years Candidate predictors: (a) Clinical (b) Quantitative stenosis severity (number of vessels diseased) (c) Quantitative atherosclerotic and vascular morphology variables Used cause-specific Cox regression models to estimate predictor-outcome associations and calculate individual patient risk scores, accounting for non-CV death as a competing risk Risk prediction models compared based on discrimination ability, quantified by the area under the receiver operating characteristics curve (AUC; aka C-statistic) Whole Heart Atherosclerosis Quantification and Risk in the ISCHEMIA Trial
Baseline Study Characteristics: n=3847 Variable % or Median (Q1, Q3) Age, years (median, interquartile range [IQR]) 64 (58, 70) years Male 79% Smoking, current 13% Smoking, former 45% Diabetes 41% Hypertension 70% Family history of premature CAD 27% Prior CVD (prior CABG, PCI, MI, or carotid surgery or stent) 20% eGFR 85 (73, 100) mL/min Ejection fraction (median, IQR) 60 (56, 65) 98.3% (3847 / 3913) participants from ISCHEMIA with CCTA (protocol or non-protocol) n=66 CCTAs could not be located (clinical characteristics did not differ from analyzed participants) Whole Heart Atherosclerosis Quantification and Risk in the ISCHEMIA Trial
CT Angiographic Results (Trial Core Laboratory Visual Stenosis Estimation) Variable % or Median (Q1, Q3) Definition Segment Involvement Score 12 (10-13) # segments w/ stenosis (max=16) CT Angiographic Stenosis (Visual Estimation) Non-obstructive 0% # vessels with 50% stenosis 1VD 18% 2VD 24% 3VD 35% Non-Evaluable 23% Whole Heart Atherosclerosis Quantification and Risk in the ISCHEMIA Trial
Median ISCHEMIA Participant Total Plaque Volume: >90th Percentile for the General Population ISCHEMIA Trial (Moderate or Severe Ischemia, N=3847) Miami Heart Study (Population-Based, N=2277) Median 79 mm3 (IQR 21, 179) Median 501 mm3 (IQR 278, 846) Preliminary Data from the Miami Heart Study (NCT02508454), Courtesy of Khurram Nasir and Jonathan Fialkow
CAD Characteristics: Extent, Severity, Type, Volume Quantitation Variable % or Median (Q1, Q3) Definition 501 mm3 (278, 846) Volume of atherosclerosis, mm3 Total Plaque Volume 6 mm3 (2, 16) Volume of atherosclerosis w/ HU < 30, mm3 Low-Density Non-Calcified Plaque Volume Number of High-Risk Plaques (HRP) 1 (0, 3) Number of plaques with <30 HU with positive remodeling (index >1.1) Number of Lesions with >30% Stenosis (Diffuseness) 4 (2, 6) Number of atherosclerotic lesions across vessel length 198 mm3 (119, 312) Proximal Segments: Non-calcified Plaque Volume Volume of NCP in proximal LAD, LCx and RCA or mid LAD Remodeling Index >1.5 (any lesion) 39% Maximum vessel diameter at lesion / normal reference diameter >1.5 3 (3, 4) mm2 3D Lumen Volume Narrowing Lumen volume / vessel length Narrow distribution of CAD, with very few mildly abnormal scans 7.8% of >32,000 vessels could not be included in quantitative analysis of atherosclerosis/vascular morphology due to artifact (calcium, motion, etc) Whole Heart Atherosclerosis Quantification and Risk in the ISCHEMIA Trial
Univariable Hazard Ratios for CV Death or MI Variable Hazard Ratio (95% Confidence Interval) P Value Number or Vessels Diseased by Quantitative CT Stenosis (reference: no quantitative >50% stenosis) 1VD 2VD 3VD <0.001 1.03 (0.76-1.40) 1.48 (1.09-2.01) 2.22 (1.63-3.04) Atherosclerotic (HR is for top to bottom tertile) P across tertiles 2.39 (1.84-3.11) Total Plaque Volume <0.001 1.39 (1.09-1.78) Low Density NCP (LD-NCP) Volume 0.027 1.36 (1.07-1.73) Volume of Proximal, Non-Calcified Plaque 0.028 1.59 (1.28-1.97) Number of High-Risk Plaques <0.001 1.37 (1.12-1.66) Remodeling Index >1.5 in Any Lesion vs. Not 0.002 1.96 (1.54-2.50) Diffuseness (Number of Lesions >30% Stenosis) <0.001 0.61 (0.48-0.79) Lumen Volume / Length <0.001 Whole Heart Atherosclerosis Quantification and Risk in the ISCHEMIA Trial
Multivariable Hazard Ratios for CV Death and MI Clinical Number of Vessels with 50% Stenosis (Quantitative Analysis) Atherosclerotic Quantitation Variable Hazard Ratio (95% CI) P Value Hazard Ratio (95% CI) P Variable Hazard Ratio (95% CI) P No 50% stenosis Total Plaque Volume Age 1.12 (0.93, 1.34) 0.23 reference 0.001 1.59 (1.24, 2.03) 0.001 Low Density NCP Volume Female Sex 1.06 (0.78, 1.44) 0.71 1VD 1.05 (0.73-1.50) 1.14 (0.97, 1.34) 0.12 0.047 Proximal NCP Volume Diabetes 1.22 (0.97, 1.52) 0.09 2VD 1.18 (0.80-1.75) 0.79 (0.62, 1.00) Number of High Risk Plaques Hypertension 1.84 (1.36, 2.48) 0.001 3VD 1.66 (1.08-2.56) 1.13 (0.93, 1.37) 0.21 Smoking (Current) Remodeling index > 1.5 1.10 (0.86, 1.41) 0.74 0.96 (0.75, 1.24) 0.77 Diffuseness (Number of Lesions >30% Stenosis) Lumen Volume / Length Prior CVD 1.10 (0.84, 1.43) 0.49 1.01 (0.85, 1.21) 0.88 eGFR 0.92 (0.78, 1.08) 0.31 0.74 (0.62, 0.88) 0.001 LVEF 0.88 (0.77, 0.99) 0.032 N = 3329. Skewed continuously measured variables were modeled with a square root transformation. All continuously measured variables were scaled to represent an interquartile increase from the 25th percentile to the 75th percentile. Data are preliminary.
Discrimination of Prediction Model 6 Month CVD/MI 2 Year CVD/MI 4 Year CVD/MI Model AUC (95%CI) P ( -AUC) Model AUC (95%CI) P ( -AUC) Model AUC (95%CI) P ( -AUC) Clinical 64% (59-68) - Clinical 60% (55-65) - Clinical 61% (58-65) - QCT Number of Vessels 50% added 65% (61-68) 0.006 vs. clinical QCT Number of Vessels 50% added 68% (63-72) 0.007 vs. clinical QCT Number of Vessels 50% added 61% (56-66) 0.32 vs. clinical Quant. Athero. added 67% (63-71) 0.09 vs. clinical + stenosis Quant. Athero. added 65% (60-70) 0.002 vs. clinical + stenosis Quant. Athero. added 69% (64-74) 0.36 vs. clinical + stenosis Overall: Discrimination accuracy was modest Possible time-dependent effects Near-Term: CT number of vessels diseased improved risk prediction at 6 months and 2 years Long-Term: Atherosclerosis and vascular morphology quantification improved risk prediction at 4 years Whole Heart Atherosclerosis Quantification and Risk in the ISCHEMIA Trial
Conclusions ISCHEMIA enrolled patients with very high plaque burden, including numerous high-risk atherosclerotic plaque features as defined by prior studies Several atherosclerotic and vascular morphology features were associated with CV death or MI in follow up: Plaque volume and morphology, high-risk plaque, proximal plaque location, plaque diffuseness, number of vessels diseased, lumen volume Total plaque volume, number of vessels diseased and smaller lumen volume were associated with CV death or MI independent of clinical risk factors Overall, accuracy of discrimination of risk of CV death or MI was modest Additional analyses are ongoing; data are preliminary Whole Heart Atherosclerosis Quantification and Risk in the ISCHEMIA Trial
THANK YOU #AHA21