Charter School Funding in Massachusetts
Explore the policy and practices surrounding charter school funding in Massachusetts as presented to the Board of Elementary and Secondary Education. Learn how the funding system works, the financial impact on sending districts, tuition rates, school choice rates, and surplus give-backs under the Achievement Gap Act.

Download Presentation

Please find below an Image/Link to download the presentation.
The content on the website is provided AS IS for your information and personal use only. It may not be sold, licensed, or shared on other websites without obtaining consent from the author. If you encounter any issues during the download, it is possible that the publisher has removed the file from their server.
You are allowed to download the files provided on this website for personal or commercial use, subject to the condition that they are used lawfully. All files are the property of their respective owners.
The content on the website is provided AS IS for your information and personal use only. It may not be sold, licensed, or shared on other websites without obtaining consent from the author.
E N D
Presentation Transcript
Charter School Funding in Massachusetts Policy and Practice Presentation to the Board of Elementary and Secondary Education March 26, 2019
01 How does the funding system work? TOPICS What is the financial impact on sending districts? 02
How does the funding system work? One of several tuition-based out of district enrollment options Commonwealth charter schools, inter-district school choice, non-resident Chapter 74, inter-district tuition agreements, Commonwealth virtual schools, private special education schools Common elements o Students included in home (sending) district s foundation budget and Chapter 70 aid o Home district makes tuition payment to receiving district based on pre-determined tuition rates and the number of students 3 Massachusetts Department of Elementary and Secondary Education
Charter school tuition rates Basic principle: replicate what the sending district would have spent if charter students were educated in-district Tuition rate established by DESE for each town/school combination Based on foundation budget for those students Additional increment for above foundation spending Applied to actual enrollment (including mid-year adjustments) 4 Massachusetts Department of Elementary and Secondary Education
Why not school choice rates? Inter-district school choice funding assumes that incoming students are filling empty seats in existing schools and classrooms oMarginal cost of educating these students is relatively low For charter schools, tuition is the primary source of revenue o Need to cover full cost of all school operations through tuition 5 Massachusetts Department of Elementary and Secondary Education
Surplus give-backs Achievement Gap Act (St. 2010, c.12) created requirement to identify surplus funds held by charter schools and return them to sending districts Calculation rubric established by DESE in consultation with State Auditor; included in required annual audits Charter schools permitted to hold funds for working capital and cash flow needs, contingencies, and planned capital projects 6 Massachusetts Department of Elementary and Secondary Education
Facility and transportation costs Facility costs oCharter schools not eligible for school building assistance grants oState pays $893 per pupil in lieu of SBA funding oMay be supplemented by outside fundraising Transportation costs oHost district must provide based on its own policies oRegional charter schools eligible for regional transportation reimbursement 7 Massachusetts Department of Elementary and Secondary Education
Who bears the cost? Basic premise local taxpayers pay a share of charter tuition, just as they pay a share of costs for in-district students Example: Boston (FY19) Budgeted net school spending Chapter 70 aid $1,174M $ 220M (19%) Charter school tuition: $ 178M State share Local share $ 34M (19%) $144M 8 Massachusetts Department of Elementary and Secondary Education
Transitional reimbursement Intended as temporary assistance to give districts time to adjust to lower enrollments Current statutory formula: any tuition increase triggers 100% reimbursement in first year, 25% in next five years Not fully funded (FY19 80% of year one, nothing for years 2-6) Proposed changes in Governor s school finance bill o Return to three year schedule (100%/60%/40%) o Focus on significant enrollment increases, not minor fluctuations and tuition rate increases o Increase funding to reach full funding by FY22 9 Massachusetts Department of Elementary and Secondary Education
Accounting for state aid and charges Cherry Sheets C.S. 1-EC Commonwealth of Massachusetts Department of Revenue FY2019 NOTICE TO ASSESSORS OF ESTIMATED CHARGES General Laws, Chapter 59, Section 21 C.S. 1-ER Commonwealth of Massachusetts Department of Revenue FY2019 NOTICE TO ASSESSORS OF ESTIMATED RECEIPTS General Laws, Chapter 58, Section 25A Boston A. COUNTY ASSESSMENTS: Boston County Tax 0 Suffolk County Retirement 3,874,532 A. EDUCATION: Essex County Reg Comm Center 0 Distributions and Reimbursements: Sub-Total, County Assessments: 3,874,532 B. STATE ASSESSMENTS AND CHARGES: Chapter 70 220,001,735 Retired Employees Health Insurance School Transportation 10,886 0 Retired Teachers Health Insurance 0 Charter Tuition Reimbursement 22,661,898 Mosquito Control Projects 282,213 Smart Growth 0 Air Pollution 261,883 Offset Items Reserve for Direct Expenditure: Metropolitan Area Planning Council 347,576 School Choice Receiving Tuition Old Colony Planning Council 0 0 Sub-Total, All Education Items: RMV Non-Renewal Surcharge 242,663,633 2,264,920 Sub-Total, State Assessments: B. GENERAL GOVERNMENT: 3,167,478 C. TRANSPORTATION AUTHORITIES: Distributions and Reimbursements: MBTA 88,209,579 Unrestricted General Government Aid 195,892,075 Boston Metro. Transit District 12,013 Local Share of Racing Taxes 323,653 Regional Transit 0 Regional Public Libraries Sub-Total, Transportation Assessments: 2,706,384 88,221,592 Urban Revitalization D. ANNUAL CHARGES AGAINST RECEIPTS: 0 Special Education Veterans Benefits 782,439 1,628,119 STRAP Repayments Exemp: VBS and Elderly 0 1,016,542 Multi-Yr Repayment 0 State Owned Land 318,922 Sub-Total, Annual Charges Against Receipts: 782,439 Offset Item - Reserve for Direct Expenditure: E. TUITION ASSESSMENTS: Public Libraries School Choice Sending Tuition 702,827 1,106,821 Sub-Total, All General Government: Charter School Sending Tuition 202,588,522 194,943,712 Sub-Total, Tuition Assessments: C. TOTAL ESTIMATED RECEIPTS: 445,252,155 196,050,533 F. TOTAL ESTIMATED CHARGES: 292,096,574 10 Massachusetts Department of Elementary and Secondary Education
What is the financial impact on sending districts? oHow would we define financial impact? oWhat are the challenges in measuring financial impact? oHow much is too much? 11 Massachusetts Department of Elementary and Secondary Education
Defining financial impact oLevel services benchmark Can the district respond to loss of enrollment with offsetting savings? oOpportunity cost benchmark What would the district do with a higher funding level? 12 Massachusetts Department of Elementary and Secondary Education
Considerations in measuring a districts ability to reduce costs Potential marginal savings depend on how many students leave the district, what grades they were in, and what schools they attended Transportation costs for host districts also depend on where students live and what the district s busing policies are The greater the enrollment loss, the more opportunities to achieve offsetting savings If there are potential cost savings, is the school committee willing to make the necessary budgetary decisions? 13 Massachusetts Department of Elementary and Secondary Education
Other enrollment and revenue uncertainties Charter school enrollment patterns Overall district enrollment and chapter 70 trends Current building utilization and possible impact on future capital projects Future municipal appropriation decisions 14 Massachusetts Department of Elementary and Secondary Education
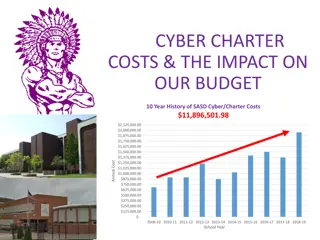
Boston in-district per pupil spending vs charter enrollment Boston Public Schools in-district per pupil spending and charter school enrollment: FY09-FY18 $25,000 25,000 $22,749 $18,952 $20,000 20,000 Charter school pupil FTEs $15,000 15,000 $ per pupil $10,000 10,000 10,252.3 $5,000 5,000 4,962.1 $0 0 FY09 FY10 FY11 FY12 FY13 FY14 FY15 FY16 FY17 FY18 Total $ per pupil Pupil FTEs 15 Massachusetts Department of Elementary and Secondary Education
Research studies Fiscal and Education Spillovers from Charter School Expansion, MIT School Effectiveness & Inequality Initiative (authors Matthew Ridley and Camille Terrier), July 2018 The True Cost of Boston's Charter Schools, Boston Municipal Research Bureau, April 3, 2016 Public Education Funding in Massachusetts: Putting Charter Schools in Context, Massachusetts Taxpayers Foundation, September 28, 2016 16 Massachusetts Department of Elementary and Secondary Education
How much is too much? Current statutory caps: o Most districts: charter tuition cannot exceed 9% of net school spending o Achievement Gap Act: cap increased to 18% in lowest performing districts o Question 2 did not change the current caps Districts closed to charter expansion in 2018-19 application cycle BERLIN BOSTON BOURNE BRIMFIELD BROOKFIELD CAMBRIDGE CHESTERFIELD GOSHEN CLARKSBURG CONWAY DRACUT EASTHAM EDGARTOWN ERVING EVERETT FALL RIVER FARMINGTON RIVER FLORIDA FRANKLIN FRONTIER HADLEY HANCOCK HATFIELD HAWLEMONT HOLLAND HOLYOKE LEVERETT LOWELL LYNN MALDEN MEDFORD MELROSE NEW SALEM WENDELL OAK BLUFFS ORLEANS PELHAM PETERSHAM PLAINVILLE PLYMOUTH PLYMPTON PROVINCETOWN RANDOLPH RICHMOND ROWE SALEM SANDWICH SAVOY SHUTESBURY SOMERVILLE SUNDERLAND TISBURY TRURO UPISLAND WALES WELLFLEET WESTHAMPTON WHATELY WILLIAMSBURG WORTHINGTON 17 Massachusetts Department of Elementary and Secondary Education
How much is too much? In setting statutory caps, Legislature indicates awareness of potential impact on sending districts and gives its answer to the how much is too much question Reflects policy decision that any negative impact is outweighed by the benefits of offering more high-quality educational choices to families Reinforced by Legislature s decision to raise cap in lowest performing districts which include many of the poorest districts In the charter authorizing process, the Department and Board have consistently over the years refrained from establishing lower caps, either as a general policy or in specific instances: o Questionable legal authority given clear statutory language o Difficulty in measuring impact Need for adequate school funding, for all schools, is a major focus of this legislative session 18 Massachusetts Department of Elementary and Secondary Education