Chemical Composition and Generation Rates in Solid Waste Management
Information on the chemical analysis and composition of solid waste is crucial for evaluating alternative processing and recovery options. Key properties include proximate and ultimate analysis, heating value, nutrient value, and future changes in composition. Understanding generation rates involves measuring quantities, statistical analysis, unit expressions, and methods for assessment.

Download Presentation

Please find below an Image/Link to download the presentation.
The content on the website is provided AS IS for your information and personal use only. It may not be sold, licensed, or shared on other websites without obtaining consent from the author.If you encounter any issues during the download, it is possible that the publisher has removed the file from their server.
You are allowed to download the files provided on this website for personal or commercial use, subject to the condition that they are used lawfully. All files are the property of their respective owners.
The content on the website is provided AS IS for your information and personal use only. It may not be sold, licensed, or shared on other websites without obtaining consent from the author.
E N D
Presentation Transcript
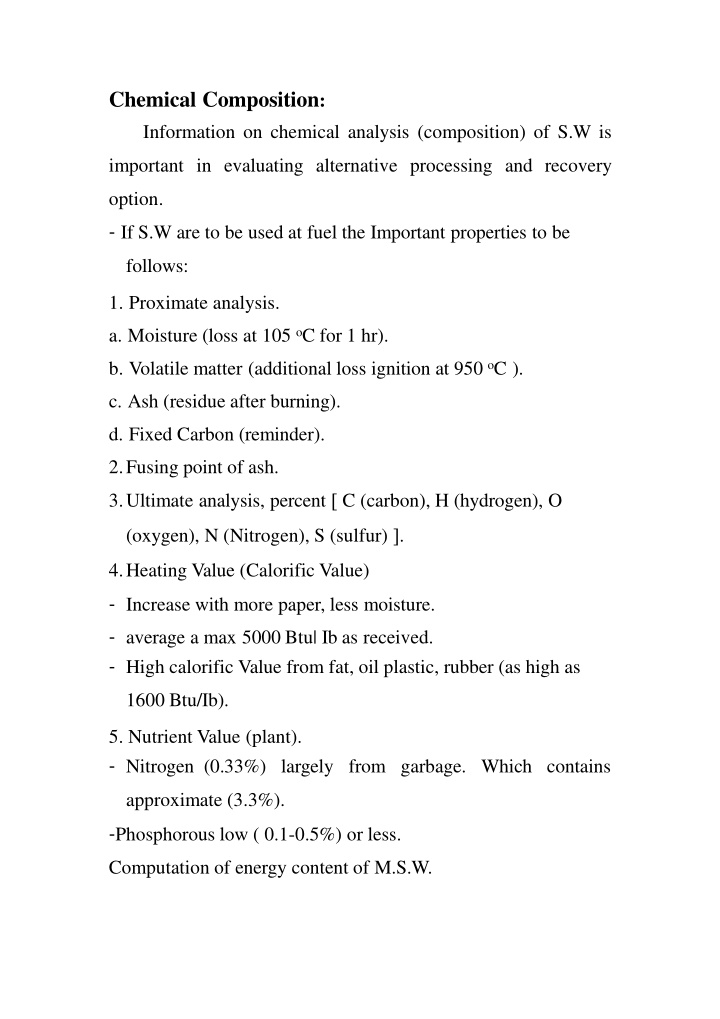
Chemical Composition: Information on chemical analysis (composition) of S.W is important in evaluating alternative processing and recovery option. - If S.W are to be used at fuel the Important properties to be follows: 1. Proximate analysis. a. Moisture (loss at 105 oC for 1 hr). b. Volatile matter (additional loss ignition at 950 oC ). c. Ash (residue after burning). d. Fixed Carbon (reminder). 2.Fusing point of ash. 3.Ultimate analysis, percent C (carbon), H (hydrogen), O (oxygen), N (Nitrogen), S (sulfur) . 4.Heating Value (Calorific Value) - Increase with more paper, less moisture. - average a max 5000 Btu| Ib as received. - High calorific Value from fat, oil plastic, rubber (as high as 1600 Btu/Ib). 5. Nutrient Value (plant). - Nitrogen (0.33%) largely from garbage. Which contains approximate (3.3%). -Phosphorous low ( 0.1-0.5%) or less. Computation of energy content of M.S.W.
Kj/Kg=2.326 Btu/Ib Future Change in Composition: important in S.W management planning of future trends in Composition for example. If a paper recycling program is to be developed (long term planning). -Food waste quantity collected has changed significantly (U.S.A) over the year as public attitude change regarding the use of home grinder and the development of the food processing and packaging industry. -Plastic wide spread use might affect the characteristics of combined S.W. -The percentage of paper in S.W has increased greatly in recent year in (U.S. A) and trend will continue in the future. Generation rate: 1. Measure of quantities. 2. Statistical analysis of generation rates. 3. Expression of unit generation rates. 4. Typical generation rates. 5. Methods used to determine generation rate. 6. Factors that affect generation rates.
1. Measure of quantities: Both Volume and weight are used for the measurement of S.W quantity. -The use of volume as measure can be extremely misleading (loose waste and compacted and in land fill), so if volume is used it should be related to be degree of compaction of the waste. -To avoid confusion, S.W quantity should be expressed in term of weight. 2. Statistical analysis generation rates include the mean mode, standard deviation and coefficient of variation. 3. Expressions of unit generation rates: In addition to knowing the source and composition of the S.W, it is important to develop meaningful units for expressing the quantities generated in different generations source. -Residential wastes: relatively of stable nature in a given location, the most common unit is Ib/c/d, Kg/c/d. -Commercial waste, the practice is to relate the quantities generated to the no. of customers. -Industrial, ideally waste generated should be expressed on the basis of some repeatable measure of production such as Kg per automobile factories kg per case for a packaging factories.
- Agricultural activities: usually expressed in terms of some repeatable measure of production such cars. Kg of monure per 700 kg cow per day Kg waste per ton of row product (meat or milk, etc) 4- Methods used to measure generation rates: Method for assessing the per capital generation rates of S.W are: 1. Load count analysis. 2. Weight volume analysis. 3. Material balance analysis. 4. Load count analysis : The number of individual loads and the corresponding vehicle characteristics are noted over a specific time period, weight date are recorded and by knowing the contributing in habitants. We can easily estimate the per capita generation rate. 2. Weight volume analysis: Use of detailed weight volume date for each waste load provide better information on the density of the varies of forms S.W at given location. 3. Material Balance analysis: The only way to determine the generation and the movement of S.W with a good degree of reliability By perform the detailed material Balance analysis for each generation source such as: Individual home, commercial and industrial activity This method is used only in Special Situation the approach as follow:
First: draw a system. boundry around the unit to be studied. Second: Identify all the activities that occur within the boundary and affect the generation of waste (In put) (out put) and (stored) Third: using material Balance determine the quantity of waste generated, collected and stored out flow ( incineration gas andashes) out flow (material) Storage (material, products and S.w The flow (material) out flow (product) boundary system Out flow (S.w) Fig. Material balance definition sketch
6- Factors that effect generation rate: 1. Geographic location. In the warmer southern areas where the growing season is considerably longer than in the northern areas, wastes are collected not only in considerably greater amounts but also over a longer period of time. 2. Season of year: The quantities of curtain types of S.W are also affected by the season of the year for example the quantities of food wastes are affected by the growing season for vegetable and fruits. 3. Frequency of collection: In general it has been observed that where unlimited service is provided, more wastes are collected. This observation should not be used as more waste is generated. 4. Use of home grinders: While the use of home grinders definitely reduce the quantity of food waste collected, it is not clear whether they affect quantities of waste generated. Because the use of home grinders varies widely throughout the country, the effects of their use must be evaluated separately in each situation. 5. Characteristics of population: It has been observed that the characteristics of the population influence the quantity of S.W generated for example: the quantities of waste generated on a per capita are
considerably greater in many of the wealthier neighborhoods than in others parts of town. 6. The extend of salvage and recycling: The existence of salvage and recycling operation within a community definitely affects the quantities of wastes collected. Whether such operation affect the quantities generated is another question. 7. Legislation. Perhaps the most important factor affecting thegeneration of certain types of wastes is the existence of local, state and federal regulations concerning the use and disposal of specific materials. Legislation dealing with packaging and beverage container material is an example. 8. Public attitudes. Significant reductions in the quantities of S.W that are generated will occur. If people are willing to change on their own volition their habits and life style.