Chemistry Lecture on Statistical Tests & Methods

This lecture covers topics such as F-Test for comparing precision, t-Tests for bias determination, and examples illustrating their application in analytical chemistry experiments. Understand the significance of statistical tests in experimental data analysis and decision-making in laboratory settings. Explore concepts like data averaging, least squares regression, and the value of method comparison in analytical chemistry practices.

Uploaded on Apr 27, 2025 | 1 Views
Download Presentation

Please find below an Image/Link to download the presentation.
The content on the website is provided AS IS for your information and personal use only. It may not be sold, licensed, or shared on other websites without obtaining consent from the author.If you encounter any issues during the download, it is possible that the publisher has removed the file from their server.
You are allowed to download the files provided on this website for personal or commercial use, subject to the condition that they are used lawfully. All files are the property of their respective owners.
The content on the website is provided AS IS for your information and personal use only. It may not be sold, licensed, or shared on other websites without obtaining consent from the author.
E N D
Presentation Transcript
Announcements Exam 1 on Oct. 4th Next Week on Wednesday Will Cover Ch. 1, 3, 4, and parts of 6 Water Hardness Lab Now due 10/2 Lab Manual Problem Today s Lecture Gaussian Statistics (Chapter 4) Statistical Tests (F-test, t-tests, Grubb s Test) Value of data averaging Least Squares Regression (if time)
F - Test Used to compare precision of two different methods (to see if there is a significant difference in their standard deviations) or to determine if two sample sets show different variability (e.g. standard deviations for mass of fish in Lake 1 from a hatchery vs Lake 2 native fish) Example: butyric acid is analyzed using HPLC and IC. Is one method more precise? Method HPLC IC Mean (ppm) 221 188 S (ppm) 21 15 n 4 4
F - Test Example cont. IC method is more precise (lower standard deviation), but is it significant? We need to calculate an F value 2 2 21 S Then, we must look up FTable (= 9.28 for 3 degrees of freedom for each method with 4 trials) =S = . 1 = 96 1 FCalc 2 2 2 15 This requires S1 > S2, so 1 = HPLC, 2 = IC Since FCalc < FTable, we can conclude there is no significant difference in S (or at least not at the 95% level)
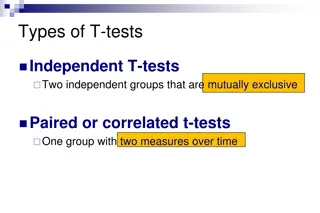
Statistical Tests t Tests Case 1 used to determine if there is a significant bias by measuring a test standard and determining if there is a significant difference between the known and measured concentration Case 2 used to determine if there is a significant differences between two methods (or samples) by measuring one sample multiple time by each method (or each sample multiple times) same measurements as used for F-test Case 3 used to determine if there is a significant difference between two methods (or sample sets) by measuring multiple sample once by each method (or each sample in each set once)
Case 1 t test Example A new method for determining sulfur content in kerosene was tested on a sample known to contain 0.123% S. The measured %S were: 0.112%, 0.118%, 0.115%, and 0.117% Do the data show a significant bias at a 95% confidence level? Clearly lower, but is it significant?
Case 2 t test Example Back to butyric acid example Now, Case 2 t-test is used to see if the difference between the means is significant (F test tested standard deviations) Method HPLC IC Mean (ppm) 221 188 S (ppm) 21 15 n 4 4
Case 3 t Test Example Case 3 t Test used when multiple samples are analyzed by two different methods (only once each method) Useful for establishing if there is a constant systematic error Example: Cl- in Ohio rainwater measured by Dixon and PNL (14 samples)
Case 3 t Test Example Data Set and Calculations Calculations Conc. of Cl- in Rainwater Step 1 Calculate Difference Step 2 - Calculate mean and standard deviation in differences (Units = uM) Sample # Dixon Cl- PNL Cl- 1 9.9 17.0 7.1 2 2.3 11.0 8.7 ave d = (7.1 + 8.7 + ...)/14 3 23.8 28.0 4.2 ave d = 7.49 4 8.0 13.0 5.0 5 1.7 7.9 6.2 Sd = 2.44 6 2.3 11.0 8.7 7 1.9 9.9 8.0 Step 3 Calculate t value: 8 4.2 11.0 6.8 9 3.2 13.0 9.8 d 10 3.9 10.0 6.1 = t n Calc S 11 2.7 9.7 7.0 d 12 3.8 8.2 4.4 7.6 13 2.4 10.0 tCalc= 11.5 8.8 14 2.2 11.0
Case 3 t Test Example Rest of Calculations Step 4 look up tTable (t(95%, 13 degrees of freedom) = 2.17) Step 5 Compare tCalc with tTable, draw conclusion tCalc >> tTable so difference is significant
t- Tests Note: These (case 2 and 3) can be applied to two different senarios: samples (e.g. comparing blood glucose levels of two twins) methods (analysis method A vs. analysis method B)
Grubbs Test Example Purpose: To determine if an outlier data point can be removed from a data set Data points can be removed if observations suggest systematic errors Example: Cl lab 4 trials with values of 30.98%, 30.87%, 31.05%, and 31.00%. Student would like less variability (to get full points for precision) Data point farthest from others is most suspicious (so 30.87%) Demonstrate calculations
Dealing with Poor Quality Data If Grubbs test fails, what can be done to improve precision? design study to reduce standard deviations (e.g. use more precise tools) make more measurements (this may make an outlier more extreme and should decrease confidence interval) can also discard data based on observation showing error (e.g. loss of AgCl in transfer resulted in low % Cl for that trial)
Signal Averaging For some type of measurements, particularly where they are made quickly, averaging many measurements can improve the sensitivity or the precision of the measurement Example 1: NMR 1 scan 25 scans
Signal Averaging Example 2: High Accuracy Mass Spectrometry To confirm molecular formula, error in mass should be < 5 ppm (for mass = 809 amu, error must be < 0.004 amu) However, Smass = 0.054 amu Can requirement be met? Yes Smean mass = Smass/ n What value is needed for n to meet 5 ppm requirement 95% of time? Note: also requires accurate calibration Measured Mass = 809.4569 amu Example compound: expected mass = 809.4587 amu To meet 5 ppm limit, meas. mass = 809.4547 to 809.4628
Calibration For many classical methods direct measurements are used (mass or volume delivered) Balances and Burets need calibration, but then reading is correct (or corrected) For many instruments, signal is only empirically related to concentration Example Atomic Absorption Spectroscopy Measure is light absorbed by free metal atoms in flame Conc. of atoms depends on flame conditions, nebulization rate, many parameters It is not possible to measure light absorbance and directly determine conc. of metal in solution Instead, standards (known conc.) are used and response is measured Light beam To light Detector
Method of Least Squares Purpose of least squares method: determine the best fit curve through the data for linear model, y = mx + b, least squares determines best m and b values to fit the x, y data set note: y = measurement or response, x = concentration, mass or moles How method works: the principle is to select m and b values that minimize the sum of the square of the deviations from the line (minimize [yi (mxi + b)]2) in lab we will use Excel to perform linear least squares method