Chesapeake Bay Program Strategic Science & Research Framework
This strategic science and research framework focuses on sustaining and promoting healthy watersheds in the Chesapeake Bay region through specific goals, outcomes, and monitoring needs. It emphasizes the importance of evaluating policy options, using land use methods and metrics, and developing indicators for watershed health assessment.

Download Presentation

Please find below an Image/Link to download the presentation.
The content on the website is provided AS IS for your information and personal use only. It may not be sold, licensed, or shared on other websites without obtaining consent from the author.If you encounter any issues during the download, it is possible that the publisher has removed the file from their server.
You are allowed to download the files provided on this website for personal or commercial use, subject to the condition that they are used lawfully. All files are the property of their respective owners.
The content on the website is provided AS IS for your information and personal use only. It may not be sold, licensed, or shared on other websites without obtaining consent from the author.
E N D
Presentation Transcript
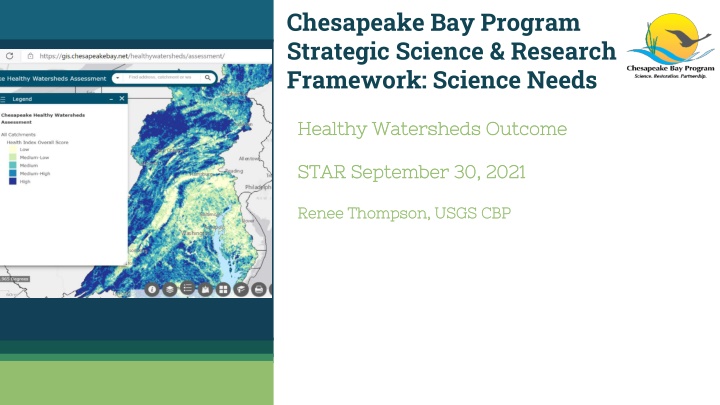
Chesapeake Bay Program Strategic Science & Research Framework: Science Needs Healthy Watersheds Outcome Healthy Watersheds Outcome STAR September 30, 2021 STAR September 30, 2021 Renee Thompson, USGS CBP Renee Thompson, USGS CBP
Goal: Sustain state- identified healthy waters and watersheds recognized for their high quality and/or high ecological value HEALTHY WATERSHEDS GOAL Outcome: 100 percent of state-identified healthy waters and watersheds remain healthy.
Sustain watershed health where it is high, exceptional and/or outstanding to increase the number of healthy watershedsin the future HEALTHY WATERSHEDS VISION Provide the forum for mutual shared learning Develop information resources Promote the science And Coordination, Integration and Collaboration.
.."Evaluate policy options, incentives and planning tools that could assist in continually improving capacity.." Data and Tools Hi-res land cover Phase 6 Land Use Viewer Data Dashboard Chesapeake Healthy Watersheds Assessment Environmental Justice and Equity Dashboard
Science Needs Land Use Methods and Metrics Land Use Methods and Metrics Land Use options Evaluation Land Use options Evaluation Outcome Outcome
Indicator Development Interim indicator investigations: impervious surface, protected lands and habitat suitability are under investigation to use as interim measures until the completion of a Healthy Watersheds Assessment 2.0 tool in 2022-2023.
Monitoring Needs Maryland Biological Stream Survey (MBSS) Chesapeake Basin-wide Index of Biotic Integrity (Chessie BIBI) 6 candidate geomorphic metrics (combination of remote sensing data and modeling analysis): Streambank lateral erosion Streambank change (m2) Streambank sediment flux incorporates bank height, lateral erosion, and bulk density Streambed D50 Streambed fine sediment cover Streambed fine sediment + sand cover MBSS Stronghold Watersheds (developed from MBSS monitoring data) Conductivity (developed from field data and modeling) Recent Forest loss (Hansen data, from remote sensing imagery a different type of monitoring)
Land Use Metrics / Hi Resolution Data Long term monitoring and evaluation Short term metrics and vulnerability Land policy BMP connections Understanding thresholds from a scientific and local government perspective. U.S. Geological Survey s Land Change Monitoring, Assessment and Projection (LCMAP 1985 2019)
User Experience and Research Decision support tools for informing decisions How can land use and land use change information best be communicated to select targeted audiences to inform land use and land conservation decisions? Understanding end user needs (of different stakeholder audiences) Improvements to data and communication to meet local needs
Synthesis and Communication Communication, Translation, (pathways), and Engagement. Translate, format, package and flow information through to trusted sources. How to effectively engage locals directly understanding target audience needs curating content and decision support resources to meet pressing priorities related to infrastructure, flooding, co-benefits, climate and DEIJ have been identified. Online tools (localized and scalable): Assess changes in impervious cover, turf grass, forests, wetlands (loss only), tree canopy, and agriculture, for any user-specified geography (e.g.,user-drawn polygons, Census Tracts, Municipalities, etc.)Output a standardized set of graphs and interpretive text tailored to graph content.
DEIJ, public health and communities How does land use composition and land change impact those communities and or local governments? Percent tree canopy, percent impervious cover, etc. Assess disproportionate impact of land use change over time in underserved communities How have investments in economic* development, conservation and restoration benefited these communities? *Note: lack of development could be a negative impact? Incorporation of public health considerations
Climate and Community Improved climate metrics for CHWA Marsh Migration potential for protection Protection of infrastructure and communities Resiliency Flood protection
Renee Thompson, Geographer Lower-Mississippi Gulf WSC, USGS, Chesapeake Bay Program, MD Coordinator Maintain Healthy Watersheds Goal Implementation Team Rthompso@chesapeakebay.net Rthompson1@usgs.gov Discussion Presentation template by SlidesCarnival.