Child Maltreatment Reports and Response Data
Explore data on child maltreatment reports, response categories, incidence rates by race/ethnicity, children in out-of-home care per 1,000, and more. Gain insights into trends and statistics related to child protection services.

Download Presentation

Please find below an Image/Link to download the presentation.
The content on the website is provided AS IS for your information and personal use only. It may not be sold, licensed, or shared on other websites without obtaining consent from the author. If you encounter any issues during the download, it is possible that the publisher has removed the file from their server.
You are allowed to download the files provided on this website for personal or commercial use, subject to the condition that they are used lawfully. All files are the property of their respective owners.
The content on the website is provided AS IS for your information and personal use only. It may not be sold, licensed, or shared on other websites without obtaining consent from the author.
E N D
Presentation Transcript
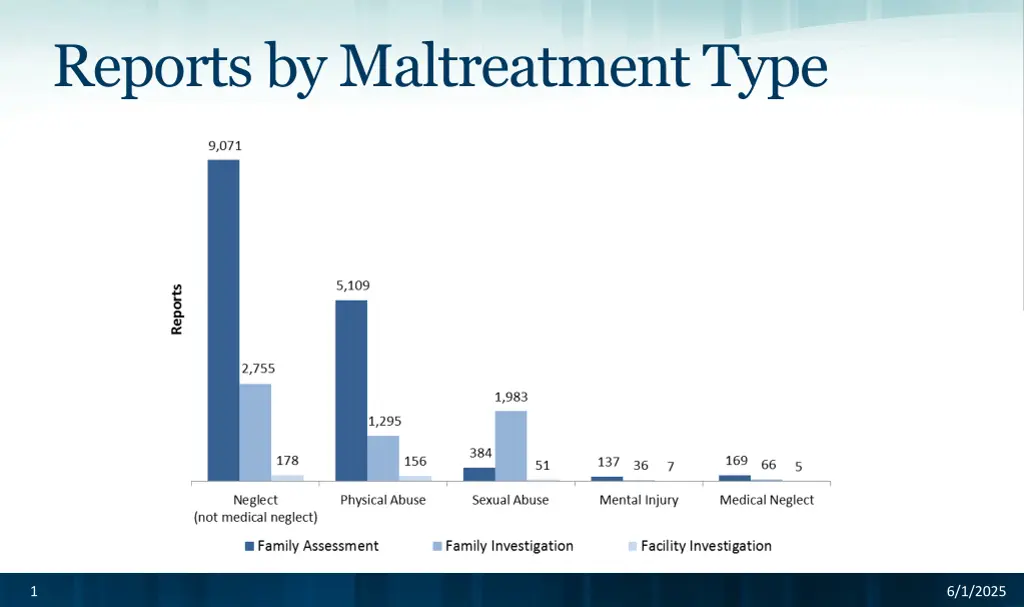
Reports by Maltreatment Type 1 6/1/2025
Front End Child Protection Flow Chart January 2015 Services provided if needed or no services needed, case closed No Family Investigation* Child protective services needed? Yes Call received by county/ tribe Screening Decision* Yes Yes Path Decision Consult with County/Tribal Attorney Possible Court Proceedings No No Yes Screened Out Child protective services needed? Family Assessment* No Family support services offered to family if needed, case closed *If at any point an immediate safety concern is present, law enforcement is called. **If a family is assessed as high risk for future maltreatment, the family s case will be opened for child protective services. 2 6/1/2025
Child Maltreatment Reports by Response Category, 2004 2013 19,602 18,818 18,674 18,348 18,284 17,717 17,716 17,380 17,294 17,218 14,177 13,007 12,243 11,176 11,723 11,427 10,934 Reports 10,627 10,207 9,983 8,691 8,611 7,414 6,667 6,203 5,478 5,309 5,185 5,083 4,989 379 365 352 348 342 338 313 288 288 317 2004 2005 2006 2007 2008 2009 2010 2011 2012 2013 Family Assessment Family Investigation Facility Investigation Total Assessments and Investigations 3 6/1/2025
Incidence per 1,000 by Race/Ethnicity and Maltreatment Type 44.1 African American/ Black 30.4 12.8 4.9 83.3 68.8 American Indian 16.3 6.4 8.3 Asian or Pacific Islander 4.8 3.3 0.8 14.3 Total 9.1 White 4.4 2.0 Neglect (non-medical) 43.9 32.4 Two or more races 10.9 Physical abuse 5.1 19.8 Sexual abuse 13.3 Total children 5.7 2.5 24.6 Hispanic ethnicity any race 16.6 6.6 3.3 Children per 1,000 in the Minnesota Child Population 4 6/1/2025
Children in Out-of-home Care per 1,000 by Race/Ethnicity, 2004 2013 83.0 82.0 80.7 78.2 78.1 77.7 70.8 69.9 69.8 69.4 Children in care per 1,000 37.6 35.8 35.8 34.6 32.0 26.7 25.4 24.9 24.3 24.0 22.9 21.6 22.7 22.1 21.6 19.6 19.2 18.7 15.1 21.4 10.0 15.1 15.3 13.9 14.6 19.7 10.2 11.6 10.8 10.3 7.6 7.8 7.4 7.3 6.6 5.5 5.6 5.5 5.6 5.3 6.2 4.9 5.4 5.1 4.0 4.9 4.1 3.6 3.6 3.8 2004 2005 2006 2007 2008 2009 2010 2011 2012 2013 African American/Black White American Indian Two or more races Asian/Pacific Islander Hispanic ethnicity any race 5 6/1/2025


