Explore the impact of adverse and positive childhood experiences on adolescent involvement in violence, analyzing data from the Millennium Cohort Study. Learn about ACEs, PCEs, and neighborhood influences, and discover how these factors shape behavior and outcomes. Gain insights into reducing youth offending and promoting resilience against negative outcomes through supportive environments.
Please find below an Image/Link to download the presentation.
The content on the website is provided AS IS for your information and personal use only. It may not be sold, licensed, or shared on other websites without obtaining consent from the author. If you encounter any issues during the download, it is possible that the publisher has removed the file from their server.
You are allowed to download the files provided on this website for personal or commercial use, subject to the condition that they are used lawfully. All files are the property of their respective owners.
The content on the website is provided AS IS for your information and personal use only. It may not be sold, licensed, or shared on other websites without obtaining consent from the author.
E N D
Presentation Transcript
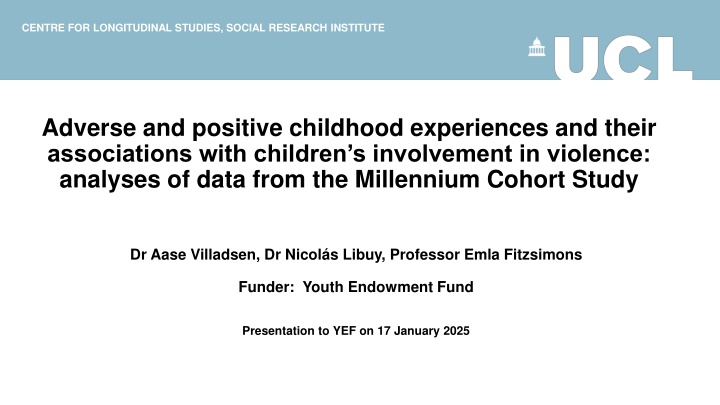
CENTRE FOR LONGITUDINAL STUDIES, SOCIAL RESEARCH INSTITUTE Adverse and positive childhood experiences and their associations with children s involvement in violence: analyses of data from the Millennium Cohort Study Dr Aase Villadsen, Dr Nicol s Libuy, Professor Emla Fitzsimons Funder: Youth Endowment Fund Presentation to YEF on 17 January 2025
Aims of study This study examines how experiences and environments in childhood is associated with violence in adolescence: Adverse childhood experiences (ACEs) Positive childhood experiences (PCEs) Neighbourhood violent crime
Adverse childhood experiences (ACEs) Framework by Felitti et al. (1998) identifies 10 ACEs. Includes abuse, neglect, family substance misuse, parental incarceration, parental separation. Focus on the accumulation of multiple family dysfunctions rather than single factors ACEs impact stress responses, brain development, and behavioural patterns. Toxic stress can lead to chronic maladaptive behaviour (Shonkoff et al., 2012). Research shows ACEs detrimental to various outcomes later in life (health, mental health, employment, crime etc)
Positive childhood experiences (PCEs) PCEs support resilience against negative outcomes (Bethell et al., 2019). Mechanisms like ACEs, but does the opposite by promoting development of competencies, self-regulation and social skills. PCEs less well developed compared to ACEs. Generally includes supportive family, peer support, school engagement, and community participation. Research links PCEs to enhanced outcomes (physical health, mental health, academic success, reduced offending). May buffer the negative effects of ACEs. Shown in previous studies, including offending (Craig et al., 2017),
Neighbourhood violence Effects of neighbourhood on individual s behaviour Theories suggest mechanisms like social networks, economic conditions, and community resources (Wilson, 1987). Exposure to or witnessing violent crime can increase likelihood of youth violence (Centre for Crime and Justice Studies, 2009). Many dimensions of the neighbourhood, violent crime is just one Selection bias makes causal inference challenging (Van Ham et al., 2011). Neighbourhood characteristics highly correlated with individual and family characteristics, which may be main drivers of youth violence
Research gaps & importance UK-based research is limited, most studies are from the US Reliance on retrospective cross-sectional data, lack of prospective longitudinal data Buffering of PCEs against ACEs is especially under-researched. Understanding differences by gender and ethnicity. Identifying predictors of youth violence highly important for policy, practice, and intervention. Relevant to Government s ambition of halving knife crime within a decade.
Research questions How do ACEs and PCEs relate to youth violence? Is neighbourhood violence an important determinant of youth violence? How do neighbourhood crime and childhood experiences (ACEs and PCEs) interact?
Data Millennium Cohort Study Longitudinal birth cohort study Children born between September 2000 and January 2002 in the UK Initial survey at age 9 months (N=19,000), follow-ups age 3, 5, 7, 11, 14 and 17 years. Interviews with main parent (usually mother), resident partner, and with child self in later sweeps. Detailed information on families and children. Including adverse and positive experiences in childhood and engagement in violence in adolescence. We include participants from England and Wales only (exclusion of Scotland and Northern Ireland) Analytical sample of 14,088 participants (multiple imputation used to deal with attrition over time)
Measures Youth violence (at age 14 and 17 combined), self reported 1) Assault perpetration (pushing, shoving, hitting, slapping or punching someone) 2) Weapon involvement (carrying or using a weapon) 3) Gang involvement (current or past membership of a street gang) ACEs (age 9 months to 11 years) 1.having a single parent, 2.parental breakup, 3.domestic violence, 4.verbal abuse, 5.physical abuse, 6.parental alcohol abuse, 7.parental drug use, 8.poor parental mental health, 9.poor parental relationship, 10.poor mother child relationship, 11. longstanding maternal disability/illness. PCEs (age 3 to 11 years) 1.good school connectedness, 2.positive teacher child relationships, 3.feeling safe in the playground, 4.low-risk peers, 5.positive peer experiences, 6.participation in activities and hobbies, 7.living in a safe neighbourhood. Neigbourhood violent crime (age 11) Police recorded violence and sexual offences in LSOA (neighbourhood) per 1000 residents. Linked using MCS participants residential postcodes. Covariates (age 9 months) sex at birth, ethnicity, maternal age at birth, income, education, occupational status, the number of sweeps in which the parent was single
What ACEs were measured when Reporter Age 9 months x Age 3 years x Age 5 years x Age 7 years x Age 11 years x Single parent status Main parent Parental breakup Main parent x x x x Domestic violence Main parent x x x x x x x x x x x Partner Interviewer Main parent Verbal abuse x x Physical abuse Interviewer Main parent x x x Parental alcohol abuse Main parent x x x x x x x x x x x x Partner Main parent Parental drug use x x x x x x Partner Main parent Poor parental mental health x x x x x Partner Main parent Poor parental relationship x x Partner Main parent Poor mother child relationship Longstanding maternal illness or disability x Main parent x x x x
What PCEs were measured when Reporter Age 9 months Age 3 years Age 5 years Age 7 years Age 11 years Good school connectedness Participant x x Positive relationship with teacher Feeling safe in the school playground Low-risk peers Participant x Participant x Participant x Positive peer experiences Participant x x Participation in activities and hobbies Living in a safe neighbourhood Participant x Main parent x x Participant x
Analyses Descriptive analyses Inferential analyses Examination of associations between predictors (ACEs, PCEs, neighbourhood violence) and youth violence (assault, weapon involvement, gang involvement) Multivariate logistic regression (outcomes are binary, 1=yes, 0=no) Covariates/control variables (sex at birth, ethnicity, maternal age at birth, income, education, occupational status, the number of sweeps in which the parent was single) Subgroup analyses Gender Ethnicity Multiple imputation (MI) Attrition over time affects all longitudinal studies Not random but socially patterned (more drop out of disadvantaged groups) MI restores sample and provides more accurate population estimates 30 complete datasets, analyses run and pooled across these, N=14,088 Weighting(for complex survey design)
Youth violence by sample characteristics Assault perpetration Weapon involvement Gang involvement 95% CI 95% CI 95% CI Prop Lower Upper Prop Lower Upper Prop Lower Upper Maternal age at birth (categories) Under 20 20 to 24 25 to 29 30 to 35 36 or over Single parent in number of sweeps (age 9m to 11y) Never One sweep Two sweeps Three sweeps Four sweeps All five sweeps 46.5% 44.9% 41.4% 40.7% 40.7% 42.4% 42.5% 39.2% 38.9% 37.6% 50.6% 47.3% 43.5% 42.6% 43.8% 14.8% 12.5% 9.5% 8.0% 7.9% 11.6% 10.1% 8.1% 6.7% 6.2% 18.0% 14.9% 10.9% 9.4% 9.7% 14.2% 11.2% 6.6% 4.5% 4.0% 11.3% 9.3% 5.4% 3.6% 2.6% 17.2% 13.1% 7.8% 5.5% 5.5% 39.4% 43.0% 47.6% 46.5% 49.0% 49.6% 38.1% 39.6% 43.7% 41.3% 44.4% 45.6% 40.8% 46.3% 51.5% 51.8% 53.7% 53.6% 7.4% 11.4% 13.1% 12.7% 17.4% 16.8% 6.4% 9.1% 9.7% 9.5% 13.1% 13.1% 8.3% 13.6% 16.4% 15.9% 21.8% 20.6% 4.5% 8.7% 9.7% 11.4% 13.5% 14.9% 3.6% 6.9% 7.1% 8.3% 9.8% 11.6% 5.4% 10.5% 12.3% 14.4% 17.3% 18.2%
ACEs descriptives Single ACEs Single parent Parental breakup Domestic violence Verbal abuse Physical abuse Parental alcohol abuse Parental drug use Parental mental health Poor parental relationship Poor mother child relationship Maternal long-term disability/illness Number of ACEs (categories) No ACEs One ACE Two ACEs Three ACEs Four ACEs Five ACEs Six or more ACEs 37.4% 28.1% 28.6% 13.3% 5.2% 20.7% 13.1% 21.8% 17.1% 9.1% 13.2% 19.5% 23.8% 21.8% 15.4% 10.0% 5.4% 4.1% Mean number of ACEs 2.08
PCEs descriptives Single PCEs Good school connectedness Positive teacher child relationship Feeling safe in the playground Safe neighbourhood Low-risk peers Positive peer experiences Activities and hobbies Number of PCEs (categories) 0 2 PCEs 3 PCEs 4 PCEs 5 PCEs 6 7 PCEs 23.7% 34.9% 58.5% 68.5% 86.7% 33.5% 73.7% 19.0% 23.7% 25.8% 18.6% 12.9% Mean number of PCEs 3.80
Association between ACEs and assault perpetration 70% 60% 52.4% Prevalence of assault 48.0% 50% 45.6% 45.0% 43.0% 39.4% 36.2% 40% 30% 20% 10% 0% None One ACE Two ACEs Three ACEs Four ACEs Five ACEs Six or more ACEs For those with six or more ACEs, the prevalence of assault perpetration is 54.4% compared to 36.2% for those with no ACEs, which is a risk ratio of 1.45 (p<0.001) or an increase in risk of 45%.
Association between ACEs and weapon involvement 20% Prevalance of weapon involvement 18% 15.4% 16% 13.8% 14% 11.7% 10.9% 12% 9.7% 10% 7.7% 8% 6.2% 6% 4% 2% 0% None One ACE Two ACEs Three ACEs Four ACEs Five ACEs Six or more ACEs Those with six or more ACEs were 2.5 times more likely to report weapon involvement than those with no ACEs (RR=2.50, p<0.001), equivalent to a 150% increase.
Association between ACEs and gang involvement 16% Prevalence of gang involvement 14% 12% 10.6% 9.7% 10% 7.9% 7.6% 8% 6.7% 5.8% 6% 4.2% 4% 2% 0% None One ACE Two ACEs Three ACEs Four ACEs Five ACEs Six or more ACEs Compared to no ACEs, those with six or more ACEs are around 2.5 times more likely to experience gang involvement (RR=2.54, p<0.001), which is an increased risk of 154%.
The top 5 most important ACEs combinations in relation to youth violence Assault Weapon involvement Gang involvement Single parent Parental drug use Domestic violence Parental alcohol abuse Parental long-term disability/illness Verbal abuse Poor parental relationship Parental drug use Single parent Domestic violence Parental alcohol abuse Parental long-term disability/illness Parental mental health Physical abuse Parental drug use Single parent Domestic violence Verbal abuse Physical abuse Parental alcohol abuse Poor parent child relationship Parental long-term disability/illness Parental breakup Parental mental health Poor parental relationship Physical abuse Parental breakup Parental mental health Poor parent child relationship Parental breakup Poor parental relationship Verbal abuse Poor parent child relationship
Association between PCEs and assault perpetration 60% 50.7% 50% 44.6% 41.7% Prevalence of assault 40% 36.4% 33.0% 30% 20% 10% 0% 0-2 PCEs 3 PCEs 4 PCEs 5 PCEs 6-7 PCEs Those with six to seven PCEs, compared to those with zero to two PCEs, had a 35% reduction in the prevalence of assault (RR 0.65, p<0.001).
Association between PCEs and weapon involvement 20% 18% Prevalance of weapon involvement 15.5% 16% 14% 12% 10.4% 10% 8.0% 8% 5.7% 5.3% 6% 4% 2% 0% 0-2 PCEs 3 PCEs 4 PCEs 5 PCEs 6-7 PCEs Those with six to seven PCEs, compared to those with zero to two PCEs, had a reduction in weapon involvement of 66% (RR=0.34, p<0.001)
Association between PCEs and gang involvement 14% 12% Prevalence of gang involvement 10.1% 10% 8% 7.2% 5.7% 6% 5.1% 4.2% 4% 2% 0% 0-2 PCEs 3 PCEs 4 PCEs 5 PCEs 6-7 PCEs Those with six to seven PCEs, compared to those with zero to two PCEs, had a reduction in gang involvement of 59% (RR=0.41, p<0.001).
The top 4 most important PCEs combinations in relation to youth violence Assault Weapon involvement Gang involvement Good school connectedness Low-risk peers Positive peer experiences Positive teacher child relationship Positive peer experiences Low-risk peers Good school connectedness Positive teacher child relationship Positive teacher child relationship Low-risk peers Good school connectedness Positive peer experiences Feeling safe in the playground Feeling safe in the playground Feeling safe in the playground Safe neighbourhood Activities and hobbies Safe neighbourhood Activities and hobbies Activities and hobbies Safe neighbourhood
ACEs and PCEs in relation to assault perpetration Low ACEs (0-2) Low PCEs (0-4) 42.8% High PCEs (5+) 33.1% High ACEs (3+) Low PCEs (0-4) 49.5% High PCEs (5+) 38.4% Those with a high number of ACEs and a high number of PCEs, compared to those with high ACEs and low PCEs, had a reduction in risk of assault of 22% (RR=0.78, p<0.001).
ACEs and PCEs in relation to weapon involvement Low ACEs (0-2) Low PCEs (0-4) 9.4% High PCEs (5+) 4.6% High ACEs (3+) Low PCEs (0-4) 14.0% High PCEs (5+) 7.2% Those with a high number of ACEs and a high number of PCEs, compared to those with high ACEs and low PCEs, had a reduction in risk of weapon involvement of 49% (RR=0.51, p<0.001).
ACEs and PCEs in relation to gang involvement 0.0% 2.0% 4.0% 6.0% 8.0% 10.0% 12.0% Low ACEs (0-2) Low PCEs (0-4) 6.5% High PCEs (5+) 4.0% High ACEs (3+) Low PCEs (0-4) 9.3% High PCEs (5+) 5.7% Those with a high number of ACEs and a high number of PCEs, compared to those with high ACEs and low PCEs, had a reduction in risk of gang involvement of 39% (RR=0.61, p<0.01).
Neighbourhood violent crime in relation to assault perpetration Lowest 20% neighbourhood violent crime Lowest 20-40% neighbourhood violent crime Middle 40-60% neighbourhood violent crime Highest 60-80% neighbourhood violent crime Highest 80-100% neighbourhood violent 39.3% 41.5% 42.6% 44.1% 44.5% Model 1: No other variables adjusted for Model 1 Model 2: Fully adjusted sex at birth, ethnicity, maternal age at birth, income, education, occupational status, the number of sweeps the parent was single, adverse childhood experiences and positive childhood experiences. Lowest 20% neighbourhood violent crime Lowest 20-40% neighbourhood violent crime Middle 40-60% neighbourhood violent crime Highest 60-80% neighbourhood violent crime Highest 80-100% neighbourhood violent 40.8% 42.6% 42.0% 43.0% 42.3% Model 2 Higher risk of assault for those growing up in neighbourhoods with a higher level of crime (Model 1), but once adjusted for child- and family-level variables, there is no association (Model 2).
Neighbourhood violent crime in relation to weapon involvements Model 1: No other variables adjusted for Lowest 20% neighbourhood violent crime Lowest 20-40% neighbourhood violent crime Middle 40-60% neighbourhood violent crime Highest 60-80% neighbourhood violent crime Highest 80-100% neighbourhood violent 7.6% 8.9% 10.5% 11.0% Model 1 Model 2: Fully adjusted sex at birth, ethnicity, maternal age at birth, income, education, occupational status, the number of sweeps the parent was single, adverse childhood experiences and positive childhood experiences. 12.2% Lowest 20% neighbourhood violent crime Lowest 20-40% neighbourhood violent crime Middle 40-60% neighbourhood violent crime Highest 60-80% neighbourhood violent crime Highest 80-100% neighbourhood violent 9.3% 9.7% 9.9% 9.7% 10.0% Model 2 Higher risk of weapon involvement for those growing up in neighbourhoods with a higher level of crime (Model 1), but once adjusted for child- and family-level variables, there is no association (Model 2).
Neighbourhood violent crime in relation to gang involvements Model 1: No other variables adjusted for Lowest 20% neighbourhood violent crime Lowest 20-40% neighbourhood violent crime Middle 40-60% neighbourhood violent crime Highest 60-80% neighbourhood violent crime Highest 80-100% neighbourhood violent 4.7% 6.1% Model 1 7.2% 8.7% Model 2: Fully adjusted sex at birth, ethnicity, maternal age at birth, income, education, occupational status, the number of sweeps the parent was single, adverse childhood experiences and positive childhood experiences. 9.7% Lowest 20% neighbourhood violent crime Lowest 20-40% neighbourhood violent crime Middle 40-60% neighbourhood violent crime Highest 60-80% neighbourhood violent crime Highest 80-100% neighbourhood violent 6.8% 7.0% 6.8% 7.1% 7.1% Model 2 Higher risk of gang involvement for those growing up in neighbourhoods with a higher level of crime (Model 1), but once adjusted for child- and family-level variables, there is no association (Model 2).
Other results Interactions between neighbourhood crime and childhood experiences in relation to youth violence No evidence that the association between ACEs and youth violence differ for those in neighbourhoods with high versus low levels of violent crime No evidence that the association between PCEs and youth violence differ for those in neighbourhoods with high versus low levels of violent crime No evidence that PCEs attenuate the association between ACEs and youth violence more in low-crime areas or high-crime areas No evidence that ACEs amplify the association between neighbourhood violent crime and youth violence No evidence that PCEs attenuate the association between neighbourhood violent crime and youth violence
Other results Ethnicity: Those of Black ethnic origin had higher levels of assault (53.3%) than those of White background (41.7%). But differences disappeared after controlling for socioeconomic family characteristics and ACEs and PCEs. Indicating that these factors explained this ethnic difference. ACEs increased the risk of assault perpetration in those of White ethnicity more than in those of Black ethnic background. Similar trends for other youth violence outcomes but not significant. No ethnic pattern in relation to PCEs and neighbourhood violent crime and association with youth violence Sex: Differences between males and females only in relation to assault. ACEs increased the risk of assault perpetration more in females, PCEs had a larger reductive effect in females Neighbourhood violent crime increased the risk of assault perpetration in females more than in males.
Other results Robustness checks Exposure to ACEs and PCEs might be driven by child s behaviour (evocative effects). Therefore, child conduct problems at age 3 were include in model as additional control. Results showed that ACEs and PCEs still had significant association with youth violence, with only minor changes in risk of violence. Unimputed sample: Replicating analyse on unimputed sample (assault: N=6,901, weapon involvement: N=4,863, gang involvement N=4,930) Similar results to main analyses using imputed data But results were less linear Less statistical power, with many non-significant results
Summary A higher number of adverse childhood experiences (ACEs) is associated with an increased risk of children engaging in violence. Especially important PCEs: parental drug use, single parenthood, parental breakup, domestic violence, parental disability/illness, physical abuse, and verbal abuse A higher number of positive childhood experiences (PCEs) is associated with a decreased risk of children engaging in violence. Especially important ACEs: low-risk peers, good school connectedness, positive teacher child relationship, positive peer experiences The link between ACEs and violence was reduced when children also had a high number of PCEs. Indicating buffering effect of PCEs. ACEs and PCEs and family characteristics better explain violence involvement than neighbourhood violent crime rates. Findings suggest that females more than males, and White more than Black groups, may be more susceptible to ACEs, PCEs, and neighbourhood violence, at least in relation to assault perpetration.
Implications for youth violence reduction Violence prevention efforts should work with children who ve experience multiple ACEs, especially parental drug use, domestic violence, physical and verbal abuse, single parent families, and parents with a long-term illness or disability. Prevention work to avoid ACEs within families in the first place Promotion of PCEs, especially for vulnerable children, with focus on healthy and positive relationships with the school and teachers and with peers. Schools based interventions may have an important role here. Addressing upstream structural and socioeconomic inequalities which are strongly associated with ACEs and PCEs Youth violence highly related to other types of youth offending, so prevention may have wider impacts on crime. Benefits of reducing youth violence also likely to enhance other future outcomes for individuals Societal benefits, including lower public costs in terms of criminal justice, healthcare, social services and benefit payments. Investments in youth violence reduction likely to save costs in the long term.
Plans for further research on ACEs and PCES Using the MCS cohort study to examine a broad range of important outcomes in adolescence (age 17) and young adulthood (age 23 data available soon-ish) Mental health Physical health Substance use Education Employment Huge thanks for funding from YEF to develop ACEs and PCEs frameworks in the MCS of immense value to a broader field of social research


")
")